


.jpg)
Note: The previous monthly update can be seen in the May 4 article titled "Recession Probability Models - May 2016."
There are a variety of economic models that are supposed to predict the probabilities of recession.
While I don't agree with the methodologies employed or probabilities of impending economic weakness as depicted by the following two models, I think the results of these models should be monitored.
Please note that each of these models is updated regularly, and the results of these - as well as other recession models - can fluctuate significantly.
The first is the "Yield Curve as a Leading Indicator" from the New York Federal Reserve. I wrote a post concerning this measure on March 1, 2010, titled "The Yield Curve as a Leading Indicator."
Currently (last updated June 3, 2016 using data through May) this "Yield Curve" model shows a 6.61% probability of a recession in the United States twelve months ahead. For comparison purposes, it showed a 6.28% probability through April, and a chart going back to 1960 is seen at the "Probability Of U.S. Recession Predicted by Treasury Spread." (pdf)
The second model is from Marcelle Chauvet and Jeremy Piger. This model is described on the St. Louis Federal Reserve site (NASDAQ:FRED) as follows:
Smoothed recession probabilities for the United States are obtained from a dynamic-factor markov-switching model applied to four monthly coincident variables: non-farm payroll employment, the index of industrial production, real personal income excluding transfer payments, and real manufacturing and trade sales. This model was originally developed in Chauvet, M., "An Economic Characterization of Business Cycle Dynamics with Factor Structure and Regime Switching," International Economic Review, 1998, 39, 969-996. (http://faculty.ucr.edu/~chauvet/ier.pdf)
Additional details and explanations can be seen on the "U.S. Recession Probabilities" page.
This model, last updated on June 1, 2016, currently shows a 3.44% probability using data through March.
Here is the FRED chart (last updated June 1, 2016):
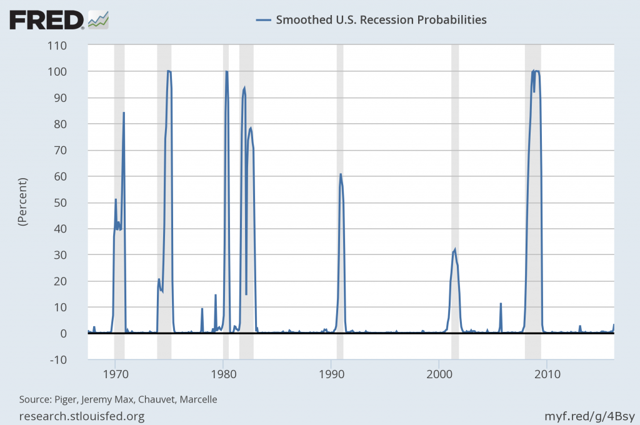
Data Source: Piger, Jeremy Max and Chauvet, Marcelle, Smoothed U.S. Recession Probabilities [RECPROUSM156N], retrieved from FRED, Federal Reserve Bank of St. Louis, accessed June 12, 2016
-
The two models featured above can be compared against measures seen in recent blog posts. For instance, as seen in the June 13 post titled "The June 2016 Wall Street Journal Economic Forecast Survey" economists surveyed averaged a 20.74% probability of a U.S. recession within the next 12 months.
_____
The Special Note summarizes my overall thoughts about our economic situation
SPX at 2079.06 as this post is written
Disclosure: I/we have no positions in any stocks mentioned, and no plans to initiate any positions within the next 72 hours.
I wrote this article myself, and it expresses my own opinions. I am not receiving compensation for it. I have no business relationship with any company whose stock is mentioned in this article.


