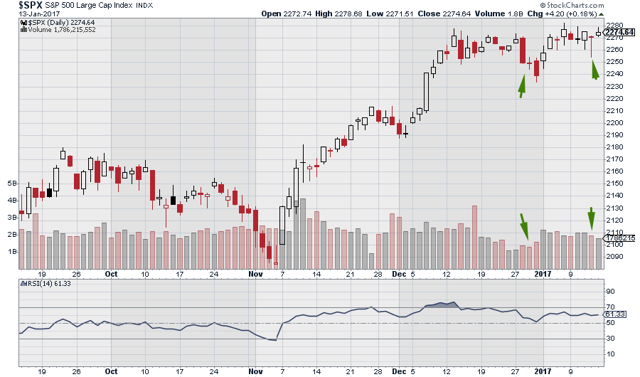
The S&P 500 (SPDR S&P 500 Trust ETF SPY) lost 0.07% last week. In other words, nothing changed. The interesting thing is that we had an almost-sell-off on the 12th of January. This didn't work out very well for bears. The market remained rock solid.
Another thing that is very supportive of a bull market is the fact that volume on down days is also down. Furthermore, I want to show you a few important indicators that tell us why the market is so solid and why bears are going to have a hard time.
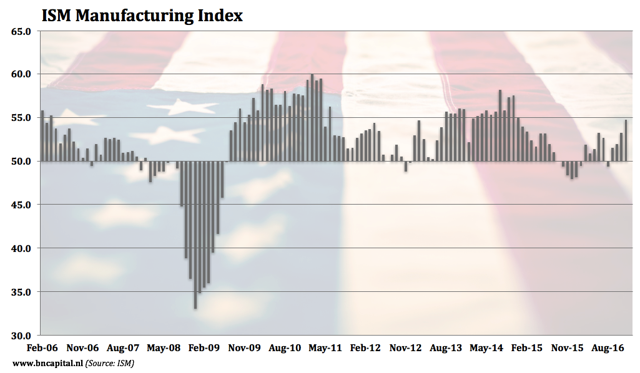
The first graph is the ISM manufacturing index. This index is a leading indicator tells us what we can expect in terms of economic growth over the next 1-3 months. It is therefore also a great indicator of the stock market. Keep this graph in mind when we are looking at the next graph.
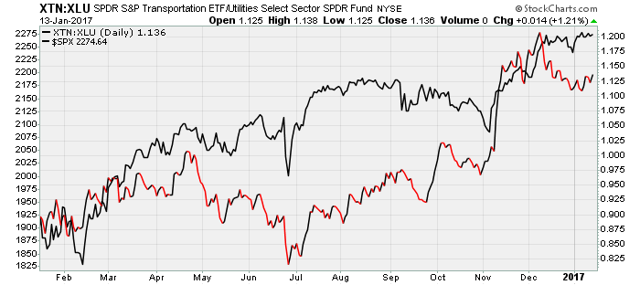
The graph below shows the ratio spread between transportation stocks and utility stocks. This ratio is called a sentiment indicator because it monitors the willingness to take risk. Transportation stocks are much more cyclical than utility stocks. Hence the high correlation versus the 'market'. In my latest S&P 500 article I mentioned that the recent underperformance of transportation stocks should be used as an entry point for people who haven't bought yet. At this point, we see that the ratio is climbing again. Not only is this good for people who are betting on it, it also supports the stock market a lot.
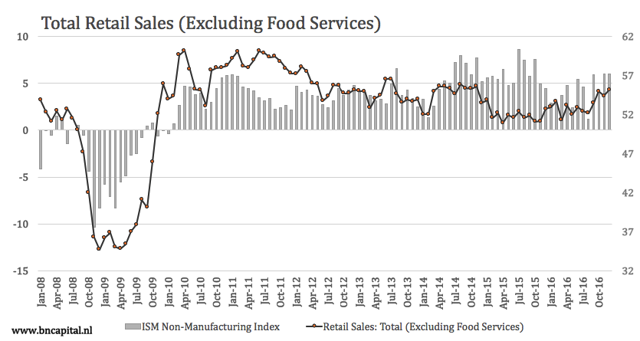
Another indicator we got last week is the official retail sales growth number. Retail sales are growing 4.3% versus one year ago. Also note the strong growth rally and the fact that retail has climbed to its highest level since 2014.
I normally don't use retail sales in my S&P 500 articles because this data is not leading. This time, I used the data to show you that the underlying fundamentals of the market are increasing. This also benefited the second sentiment index I am going to show you.
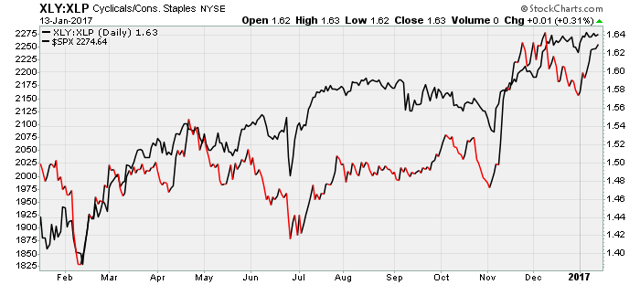
Consumer cyclicals have crushed consumer staples this year. Despite the fact that bond yields have fallen again. This is normally bad for this index since consumer staples are often dividend companies with a high yield.
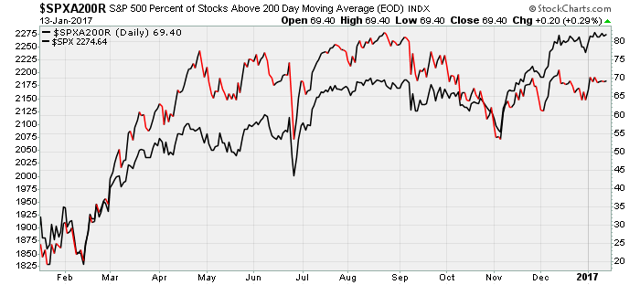
The amount of stocks above their 200 day moving average is supporting a strong stock market because the number is in an uptrend. It also shows that the market is not overbought.
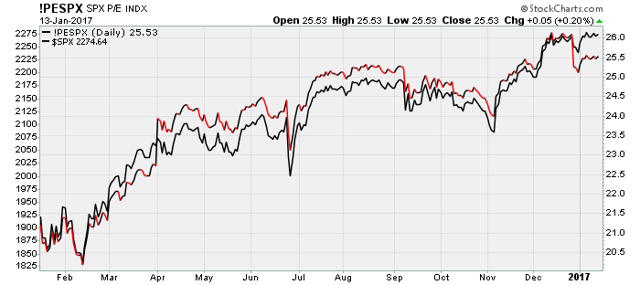
Another thing I want to show you is less important when it comes to the strength of the market on the short term. The graph below compares the S&P 500 to the S&P 500 price to earnings ratio. Stockcharts (Link redirects you to the S&P GAAP Earnings graph) adjusted the earnings about two weeks ago. The PE ratio instantly dropped one full point.
Note that I'm not trying to tell you that the market is cheap - because it simply isn't. It shows that leading indicators have pushed stocks higher supported by strong sentiment indicators. The underlying economy also benefited and earnings are higher. That is why this stock market rally can still continue despite an already rich valuation. The story would be different if growth indicators were negative...
Many thanks for reading my article. Please leave a comment below if you have questions or remarks.
Disclosure: I/we have no positions in any stocks mentioned, and no plans to initiate any positions within the next 72 hours.
I wrote this article myself, and it expresses my own opinions. I am not receiving compensation for it (other than from Seeking Alpha). I have no business relationship with any company whose stock is mentioned in this article.
Additional disclosure: During my last article (ink in article), I mentioned that I added to my long positions. I haven't sold any of these core positions. I remain long stocks like CLF, MRO and FCX etc.


.png)
