In this note, we offer for debate one of the most popular recent controversies: are the current commodity prices sufficient to support strong U.S. oil production growth in 2018?
We discuss some of the recent myths surrounding this issue and the reality the way we see it.
Is U.S. Oil Production Running Out Of Steam?
Disappointing U.S. oil production data last summer fueled a fever of "shale denial" theories in the blogosphere. The more moderate versions suggested that U.S. shales require much higher oil prices to produce meaningful expansion. The more radical theories - some falling in the "conspiracy" category - went as far as to suggest that E&P companies vastly misrepresent their well results and cost structure, and are completely financially irrational and irresponsible, whereas data reported by the U.S. Energy Information Administration (let alone its projections) cannot be relied upon.
The implicit message contained in these theories: oil prices (USO) will increase, and so will stock prices.
Some high-profile industry captains and at least one industry association joined the advocacy of higher oil prices with high-profile macro pronouncements.
Mark Papa's Macro Thesis Turns Heads
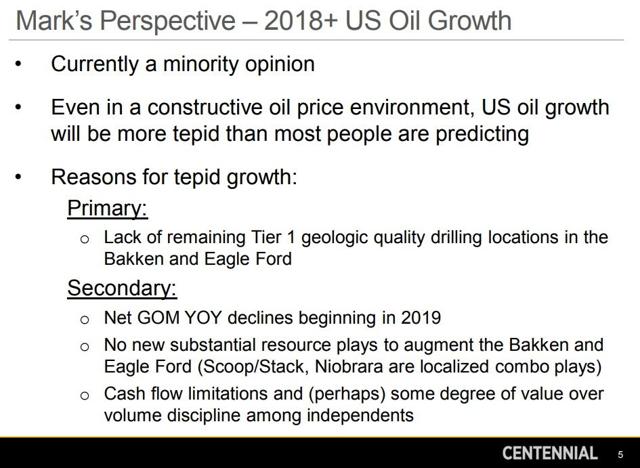
The Nov. 16 presentation at a conference by Mark Papa, CEO of the shale start-up Centennial Resource Development (CDEV), is an illustration of this "U.S. growth skepticism."
Mr. Papa is a highly regarded shale veteran and former CEO of EOG Resources (EOG). His opinion is valued. The essence of Mr. Papa's macro thesis is that "U.S. oil growth will be more tepid than most people are predicting."
(Source: Centennial Resource Development, Merrill Lynch Conference presentation, Nov. 16, 2017)
To substantiate his thesis, Mr. Papa used a number of data points and interpretations. Some of them are debatable.
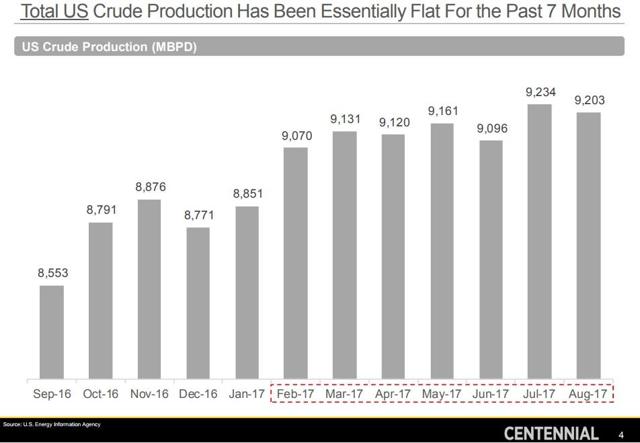
One of the supporting empirical arguments offered is the claim that U.S. production has already stagnated. The slide below notes that total U.S. crude production was little changed during the seven months ending August 2017.
(Source: Centennial Resource Development, Nov. 16, 2017)
The message on the slide accurately describes the bar graph. However, it does not capture the underlying story. Specifically, it fails to recognize that:
- Growth can be lumpy on a month-to-month basis - the time frame matters.
- The volumes reflect seasonal factors, one of which is the hurricane impact in August 2017.
- Operating activity is the driver of growth, and the trend in activity had been towards higher levels - a catch-up in growth can be around the corner.
- Conventional fields still account for a significant portion of total U.S. volumes. Production growth from shales is high in percentage terms.
Accounting for this granularity, one can arrive at a very different interpretation of the same bar graph. If one were to adjust for the Hurricane Harvey impact, U.S. onshore production growth in fact looks quite impressive. During the nine months from November 2016 through August 2017, U.S. onshore oil volumes increased at an annualized rate of ~0.6 MMb/d. Given that during that period oil prices remained relatively low and the industry was still healing after the destructive cyclical trough, such growth is anything but a sign of stagnation.
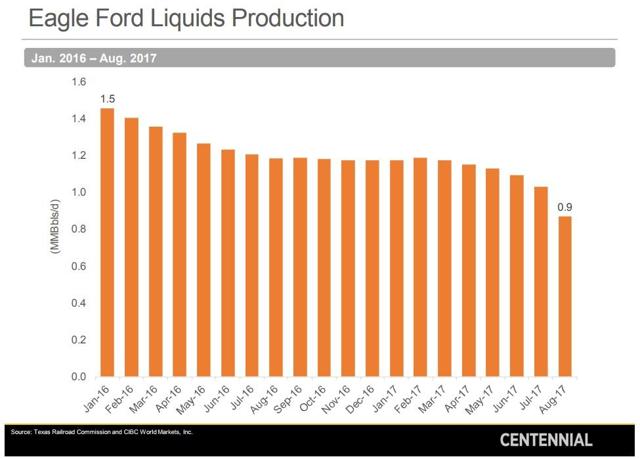
Even more surprising is the inclusion in the presentation of the following slide:
(Source: Centennial Resource Development, Nov. 16, 2017)
Given the context, the slide appears to suggest that Eagle Ford production experienced a rapid decline during the six months from February 2017 through August 2017, losing, ostensibly, roughly one-quarter of its volume during the period. If one were to extrapolate such decline, the annualized rate would look truly catastrophic. Indeed, one might reason rigs were being added, completions were accelerating, but seemingly nothing could arrest the collapse in volumes. "The shale industry is doomed," some unsuspecting readers might conclude.
In reality, the slide contains no sensation. Any observer with sufficient experience would find this graph both non-controversial and... meaningless. The data appears to be compiled from the Texas Railroad Commission's reporting system. Due to the design of the RRC's process, the database typically captures varying percentages of production during the latest months - the more recent the month, the less data is typically captured. Reports for previous months are gradually updated as additional data is added. It can take as much as half a year after the first report before the specific month adequately reflects the actual volume. As a result, for the most recent months, a mechanically plotted production report can have little relation to the actual underlying trend. In addition, in this specific case, significant production volumes were shut-in in the Eagle Ford at the end of August due to Hurricane Harvey. The rationale behind including this slide in the presentation is puzzling.
Unfortunately, not all readers have the background to interpret the above graph correctly. After flipping through the slides, some readers may form a misconception that oil production in the Eagle Ford is in rapid decline. As a result, a "myth" is born or propagated (inadvertently, of course, we are convinced). In fact, a plethora of bloggers actually have fallen into this informational pitfall, inundating the internet with the image of this slide as well as similar graphs and presenting them as supporting evidence for their "shales are struggling, oil prices are about to spike" sensation.
There is another data point in the presentation worth mentioning. The presentation mentions "current predictions" for U.S. production growth of 1.4-1.6 million barrels per day. There is no specific attribution of those "current predictions" and the price assumptions and global scenarios supporting such "current predictions" are not explained either. Obviously, the spectrum of estimates for U.S. production is quite broad. However, the presentation can leave an impression that the figure represents a market consensus of some sort - even though the quote is possibly just illustrative and is made for the purpose of contrasting Mr. Papa's own view.
An unsuspecting reader may leave with a misconception that 1.4-1.6 MMb/d growth is already baked into the current oil prices (in OIL ANALYTICS's view, absolutely not). The implication: a shortfall in the pace of U.S. production growth would represent a bullish surprise to the market.
Further in the presentation, Mr. Papa clarifies his "tepid growth" forecast. "Tepid" turns out to be not particularly tepid after all.
In a constructive oil price environment, total 2018+ US growth will be 600-750 MBD/yr. vs. current predictions of 1.4-1.6 MMBD/yr. and demand growth of 1.2-1.4 MMBD/yr.
Aside from the "predictions" quote, this prognosis does not appear particularly controversial, given that the critically important measure of the "constructive oil price environment" appears deliberately left vague and the time frame, "2018+," is not specific. In fact, the forecast - the way it is formulated - can accommodate a broad spectrum of fundamental views on oil prices, from bearish to bullish.
Overall, many operational observations made by Mr. Papa have merit and the presentation is a recommended must read for any shale oil investor. That said, there is a risk that a reader not closely familiar with the industry would walk away believing in a number of myths regarding shale oil fundamentals.
Myths vs. Reality
Myth: U.S. crude oil industry is struggling to grow production.
Reality: U.S. production growth is alive and well.
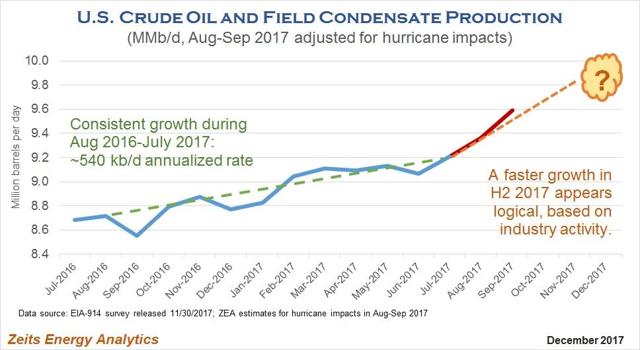
It is enough to look at the production growth chart updated for the EIA's latest monthly release and adjusted for hurricane impacts. If production could grow at a solid rate during the early phase of the cyclical recovery, when activity levels and oil prices were materially lower than they are now, there is no reason to believe that growth will unexpectedly vanish. In fact the opposite appears logical: the pace of growth should increase, at least in the near term.
Myth: Eagle Ford oil production is collapsing.
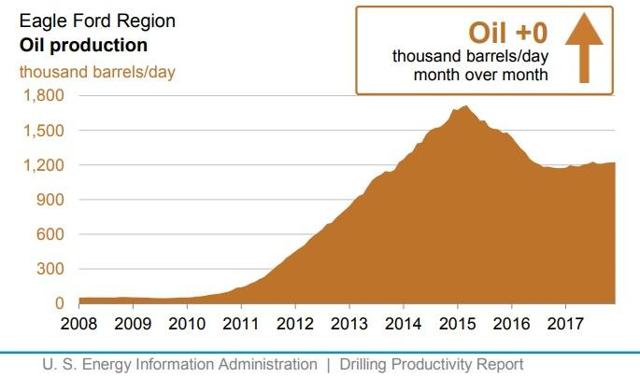
Reality: OIL ANALYTICS estimates, based on activity levels and operator reports, that Eagle Ford oil production is currently growing at a modest rate.
Consider the following estimates for Eagle Ford production from the EIA. The graph below shows no signs of production decline in 2017:
Myth: U.S. shale oil industry is not the "big bad wolf" that it used to be. Operators are now focused on free cash flows and drilling returns, which will limit growth.
Reality: The shale oil industry has not changed. It is highly competitive and entrepreneurial. Operators are driven by stock prices and asset values. Shale exploration, acreage capture and delineation remain major elements of the business model, particularly in "young" producing areas. Good acreage will continue to find capital.
It is worth noting that the "tepid growth" forecast comes from the CEO of a company that just recently spent billions of dollars aggressively acquiring core acreage in the Delaware Basin. This year, the company outspent its EBITDA by a wide margin, rapidly growing production. The current plan is to triple production by 2020 from the 2017 level. In fact, given Mr. Papa's track record of capital raising, acquisitions and operations, it would not be a big surprise to see the growth target significantly exceeded. In OIL ANALYTICS' view, the industry's "animal spirits" are alive and well.
Myth: Oil prices are discounting a multi-year U.S. oil production growth in the 1.4-1.6 MMb/d range.
Reality: While the industry has the capacity to ramp up growth to this kind of pace, the market's expectation appears a lot more measured.
A sustained growth at such rate would require infrastructure and oilfield service capacity expansion. A step up in oil prices would be required. No such step up is currently reflected in the futures curves, which is steeply backwardated (or stock prices, for that matter).
Myth: Industry CEOs are unbiased and accurate macro forecasters.
Reality: Global oil is a complex, rapidly evolving industry. As a result, fundamentals are difficult to evaluate and predict, even when forecasting is a full-time job and the forecaster is free of biases.
Disclaimer: Opinions expressed by the author in materials included in Zeits OIL ANALYTICS subscription service or posted on Seeking Alpha's public site are not an investment recommendation and are not meant to be relied upon in investment decisions. The author is not acting in an investment, tax, legal or any other advisory capacity. The author's opinions expressed herein address only select aspects of potential investment in securities of the companies mentioned or commodities and cannot be a substitute for comprehensive investment analysis. Any analysis presented herein is illustrative in nature, limited in scope, based on an incomplete set of information, and has limitations to its accuracy. The author recommends that potential and existing investors conduct thorough investment research of their own, including detailed review of the companies' SEC filings, and consult a qualified investment advisor. The information upon which this material is based was obtained from sources believed to be reliable but has not been independently verified. Therefore, the author cannot guarantee its accuracy. Any opinions or estimates constitute the author's best judgment as of the date of publication, and are subject to change without notice. The author explicitly disclaims any liability that may arise from the use of this material.
Disclosure: I/we have no positions in any stocks mentioned, and no plans to initiate any positions within the next 72 hours.
I wrote this article myself, and it expresses my own opinions. I am not receiving compensation for it (other than from Seeking Alpha). I have no business relationship with any company whose stock is mentioned in this article.


