Executive Summary
Crude oil is purchased by two different groups: the hedger and the speculator. The hedger uses the oil they buy. They may belong to an airline, an energy company or gasoline producer. The speculator will most likely never see the barrels. They will sell days, weeks or months later at, hopefully, a higher price. With both groups in the market, it can turn volatile at any point as market fears compete with supply and demand. To solve this problem, the market doesn't tend to buy oil at the current price, but instead buys what is known as 'futures' - a predefined price on a predefined date in the future. This gives both sides some protection from the financial risk of a volatile market. To ensure the future price is fair though, one must predict what the price will be on that date. Therefore, in reality, five factors influence the price of oil:
- Current Demand;
- Current Supply;
- Future Demand;
- Future Supply; and
- Market Sentiment.
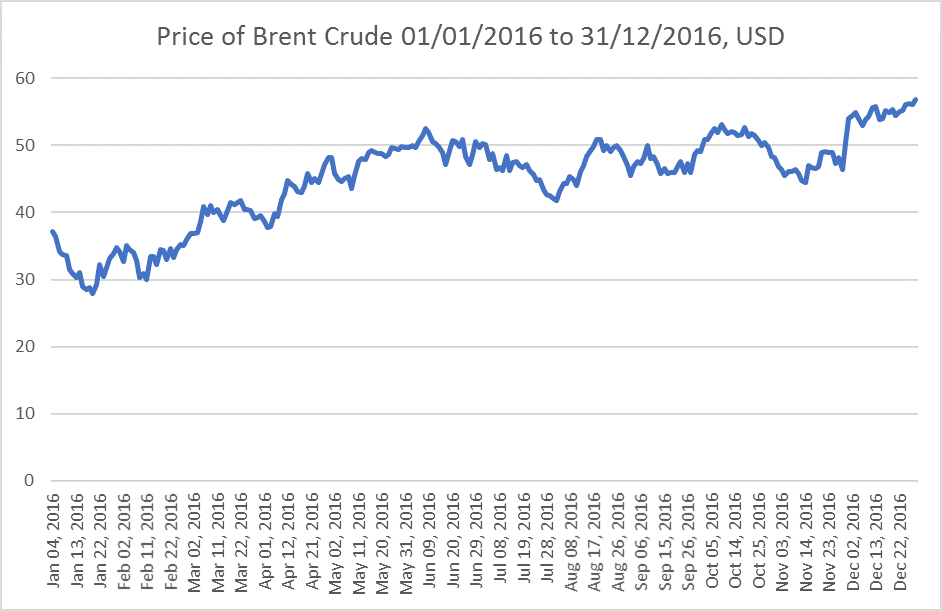
The price of oil is currently floating at around $52-54 per barrel. The chart below plots how this changed over the course of 2016:
Table 1: The changes in the price of Brent Crude [ICE] between 01/01/2016 and 31/12/2016 in USD
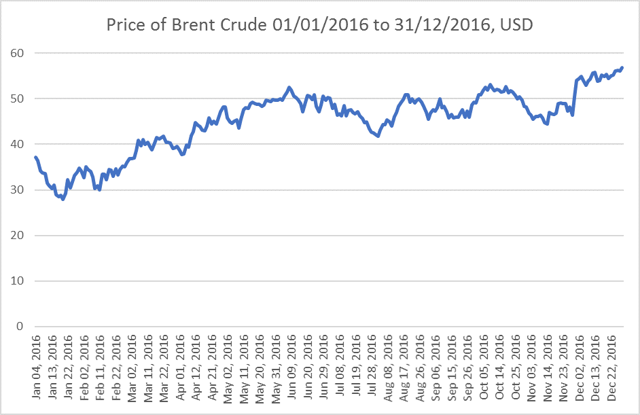
Brent Crude had a high price of $56.82 on December 30, 2016, and a low price of $27.88 on January 20, 2016. It had an annual average of $45.13.
The market is currently operating in a situation of oversupply by approximately 1.53 million barrels per day (mb/d) produced over what is needed. This oversupply has, at least partially, been responsible for the drop in oil prices, from just over $112 a barrel in June 2014 down to $27 in January 2016. Since 2008, the US production of oil has doubled due to developments in fracking, which becomes profitable above the $40-70 price point. At the same time, OPEC has refused to limit production, which would encourage stabilization in price. This is attributed to several factors, but the main reason is an attempt to drop the price of oil to a point where USA fracking is no longer profitable.
This changed in November 2016, when OPEC decided to decrease production by 1.2mb/d, and non-OPEC countries followed suit, dropping production by 0.6mb/d from January 2017. As we move into 2017, we are expecting an increase in oil price for the first half of 2017. This will be a slow but steady rising of prices, with frequent market sentiment-based price fluctuations. With the OPEC decision to renew the reduction in production due in July, we are expecting an immense level of market volatility in late June to early August. Over the second half of 2017, we are expecting the price to continue to grow at a similar rate following an OPEC decision to maintain the production agreement reached in November 2016.
Demand
Oil demand is mostly governed by changes in economic output, population change and dependency on fossil fuels rather than alternative energy sources. In Q4 2016, global demand for oil was measured at 96.95mb/d. Of this, 56.49% originated from the US, EU-5, China, India, Russia, Brazil and Japan. These 11 countries account for nearly 70% of the global GDP. The oil demand figures can be found below.
Table 2: Oil demand by country, Q4 2015, Q4 2016 and economic changes
|
Country
|
Q4 2015 Demand (mb/d)
|
Q4 2015 Global %
|
Q4 2016 Demand (mb/d)
|
Q4 2016 Global %
|
Annual Changes
|
Annual % changes
|
Annual Economic Growth
|
|
Global
|
95.58
|
100.00
|
96.95
|
100.00
|
1.37
|
1.41
|
3.40
|
|
USA
|
19.42
|
20.32
|
19.56
|
20.18
|
0.14
|
0.72
|
2.60
|
|
China
|
11.66
|
12.20
|
12.04
|
12.42
|
0.38
|
3.16
|
6.30
|
|
EU-5
|
8.12
|
8.50
|
7.93
|
8.18
|
-0.19
|
-2.40
|
1.95
|
|
India
|
4.10
|
4.29
|
4.38
|
4.52
|
0.28
|
6.39
|
7.50
|
|
Japan
|
4.14
|
4.33
|
4.08
|
4.21
|
-0.06
|
-1.47
|
1.00
|
|
Russia
|
3.52
|
3.68
|
3.74
|
3.86
|
0.22
|
5.88
|
-1.00
|
|
Brazil
|
3.20
|
3.35
|
3.10
|
3.12
|
-0.10
|
-3.23
|
-3.50
|
Energy demand is very closely linked to economic output. Oil demand, however, is more elastic as countries focus on different energy sources - for example, renewables - as well as energy efficiency. Furthermore, demand is dependent on population growth - as a country's population stabilizes, so do the number of cars being driven and the number of people needing to use energy.
Table 3: Fossil Fuel Dependency and Population Growth by Country
|
Country
|
Average Annual Population Growth (2010-2015)
|
Fossil Fuel Dependency (%)
|
|
Global
|
1.20
|
|
|
USA
|
0.78
|
83.26
|
|
China
|
0.49
|
88.14
|
|
EU-5
|
0.34
|
72.04
|
|
India
|
1.28
|
72.44
|
|
Japan
|
-0.14
|
94.74
|
|
Russia
|
0.15
|
90.72
|
|
Brazil
|
0.92
|
58.02
|
Over the course of 2016, oil demand increased by 1.41% from 95.58mb/d in Q4 2015 to 96.95 in Q4 2016. China and India, for example, both saw high economic growth, naturally leading to a higher demand for oil. On top of this, India saw a continued population explosion, leading to additional oil demand. Meanwhile, the EU-5 saw a fall in demand, despite economic growth due to a stabilization in population and a decrease in fossil fuel dependency as the EU leans further towards renewable energy sources. But overall, the drop in demand from key consumers such as the EU-5, Japan and Brazil is more than offset by vast demand growth in China and India, meaning that the global oil demand increase of 1.41% was linked to strong world economic growth, continuing fossil fuel dependency and steady population growth. Ultimately, leading into 2017, this indicates a shift in demand away from Europe and toward Asia, which may be supported by potentially reduced external demand in the USA following investment in fracking.
In 2017, we can expect continued growth, both economically and with regard to population, across Asia, leading to heightened global demand. The slowdown in EU economic growth, however, due to Brexit and market uncertainty in the EU, may lead to even further foreign investment in Asia, strengthening economic growth there. This is expected to cause an upward shift in terms of demand at a rate equal to or above the 2015/16 oil demand growth as 2016 trends.
The main demand shock that could affect prices is the issue of USA external demand. Between 2008 and 2016, US internal production of oil more than doubled from 5mb/d to 12.40mb/d, while US demand currently sits at 19.56mb/d. This means the US must import approximately 7.16mb/d from external sources - about 7.4% of global demand. Should this drop off, global demand could decrease at a proportional rate up to a total decrease of 7.16mb/d.
About half of USA oil comes from the expensive production techniques known as fracking, which require the price of oil to top $70 per barrel in order to make a profit, although for some shale fields in the US, this profit point is fast approaching $40. This cost decreases with improvements in technology. Donald Trump has promised to reduce regulations surrounding fracking in an attempt to make the US energy independent (production equal to demand). There are approximately 35 billion barrels of proven reserves in the US, with a further 120 billion estimated reserves - equal to approximately 21 years of current US demand. Should Trump succeed in turning the USA into an energy independent country, the global demand would drop by an expected 7.4%. While this is unlikely to happen in 2017 and would be financially unfeasible to manage completely, if the USA can quickly implement the reforms to fracking rules, it may be possible to offset some, or all, of the 1.37mb/d growth rate. Due to the number of more general policy commitments that Donald Trump has made, however, this is unlikely and would have more impact in 2018/19 rather than 2017.
As such, we can conclude the following for 2017 demand:
- 5/10 chance for demand growth to remain at a rate between 1.37 and 1.5mb/d, taking global demand to between approximately 98.32 to 98.45mb/d. This is due to the upshift in economic and population growth along expected levels.
- 4/10 chance for demand to increase at a rate above 1.5mb/d, taking global demand to above 98.5mb/d. This is due to a greater upshift than expected because the economy is performing better than predicted.
- 1/10 chance for demand to increase at a rate less than 1.37mb/d due to unforeseen shocks to the global economy, such as a fall in US external demand.
Supply
Oil supply is governed by the production of two groups: OPEC and non-OPEC countries. All energy exporting countries make production decisions based on whether they wish the price of oil to remain stable, decrease or increase. In the long term, if demand is equal to supply, then the price will remain stable. If demand is higher than supply, the price will increase, and vice-versa. Oil exporting countries decide on production based on how they expect other oil exporting countries to manage their production. This is where the power of OPEC lies, as it enables countries to communicate their future production levels and operate as a cartel to manage the supply, and thus set the price, as a trading bloc.
In Q4 2016, the global supply was worth 98.2mb/d, while production growth was 1.54mb/d. Of this, the biggest producers are as shown in the table below.
Table 4: Oil Production by Country (2015-2016)
|
Country
|
Production 2015
|
Global %
|
Production Q4 2016
|
Global %
|
Annual Change
|
|
Global
|
96.64
|
100.00
|
98.18
|
100.00
|
1.54
|
|
USA
|
12.99
|
13.44
|
12.40
|
12.63
|
-0.59
|
|
Russia
|
11.09
|
11.48
|
11.58
|
11.79
|
0.49
|
|
Saudi Arabia
|
10.11
|
10.46
|
10.56
|
10.76
|
0.45
|
|
Iraq
|
4.00
|
4.14
|
4.60
|
4.69
|
0.60
|
|
Canada
|
4.39
|
4.54
|
4.60
|
4.69
|
0.21
|
|
China
|
4.34
|
4.49
|
3.81
|
3.88
|
-0.53
|
|
Iran
|
2.85
|
2.95
|
3.72
|
3.79
|
0.87
|
Of these, Saudi Arabia, Iraq and Iran are OPEC members, and OPEC accounts for approximately 36% of global production. It also has good working relations with Russia and other non-OECD oil exporters, and these non-OECD countries often follow the OPEC lead in setting production levels. The USA and China mostly utilize their production to partially meet internal demand.
Since 2008, US production of oil has dramatically increased. Consequently, global demand fell, leading to a natural drop in oil prices. To add to this, high interest rates and lowering demand due to economic decline led to an oversupply. OPEC made the decision that rather than reducing production, in order to boost the price of oil to above the $70 profitable point for member countries, it would maintain production. This allowed the price of oil to drop, but also ensured that the USA fracking operations became unprofitable in many shale oil fields, therefore cutting US production and holding US demand at a constant level. In November 2016, OPEC made the key decision to cut oil production by 1.2mb/d. The full production breakdown can be found in the table below.
Table 5: Oil Production Targets for OPEC countries (pre/post-November 2016 decision; (mb/d))
|
Country
|
Original Production Target
|
January 2017 Production Target
|
Adjustment
|
|
Algeria
|
1.089
|
1.039
|
-0.050
|
|
Angola
|
1.751
|
1.673
|
-0.078
|
|
Ecuador
|
0.548
|
0.522
|
-0.026
|
|
Gabon
|
0.202
|
0.193
|
-0.009
|
|
Iran
|
3.975
|
3.797
|
+0.090
|
|
Iraq
|
4.561
|
4.351
|
-0.210
|
|
Kuwait
|
2.838
|
2.797
|
-0.131
|
|
Qatar
|
0.648
|
0.618
|
-0.030
|
|
Saudi Arabia
|
10.544
|
10.058
|
-0.486
|
|
UAE
|
3.013
|
2.874
|
-0.139
|
|
Venezuela
|
2.067
|
1.972
|
-0.095
|
Furthermore, non-OPEC/non-OECD countries have agreed to a cut of 0.6mb/d. This is expected to ensure that the global production growth shifts from 1.54mb/d to -0.26mb/d. This would lead to a production level of 97.94mb/d in 2017.
There are two further factors to consider.
First, there are questions over whether all the involved countries live up to the agreement. While countries such as Saudi Arabia with large financial reserves are more unlikely to do so, countries such as Russia, already requiring government cuts, may try to take advantage of the expected increase in prices without reducing production. The effects of this would be first to cause Russia to receive additional income, then to flood the market with oil, reducing the price and sending the market into extreme volatility, and this in turn would be destructive for countries found to have increased production. Therefore, it seems unlikely that the larger producers would break the agreement. Smaller producers may, but the effect on the global oil price would be negligible.
Second, OPEC have agreed to hold to the agreement until July 2017. At this point, they may either continue the agreement for a further 6 months, alter the agreement or cancel it.
Therefore, we can make the following 2017 supply predictions:
- 7/10 chance that in the first half of 2017, the production point will be 97.94mb/d. OPEC decides to continue pushing the price of oil up and extends the agreement. The production agreement continues for the second half of 2017 at 97.94mb/d.
- 2/10 chance that in the first half of 2017, the production point will be 97.94mb/d. After this, OPEC continues the agreement, but lowers production to equal demand. This then leads to production in the second half of 2017 of between 98.32mb/d and 98.5mb/d.
- 1/10 chance that in the first half of 2017, the production point will be 97.94mb/d. OPEC decides to end the agreement, restoring production growth to 1.54mb/d. The overall production extends to 99.72mb/d.
Oversupply and the Effect on Price
In the first half of 2017, there are two realistic possibilities:
Supply will equal 97.94mb/d.
Demand is between:
- 98.32mb/d due to maintained economic demand growth (50% chance)
- 98.5mb/d due to increased economic demand growth (35% chance)
This leads to an undersupply of between 0.38mb/d and 0.56mb/d, the previous oversupply having led to a build-up of oil in storage which is far above the five-year average. In order for prices to dramatically increase, around 400 million barrels of oil must be used from storage. In the first six months of 2017, with a daily underproduction in oil, it is unlikely that more than 58.4-101.92 million storage barrels will be used. Consequently, there is a negative correlation between oil stocks and oil prices. As such, it is likely that we will see a $3-4 bounce in the price of oil over this time, leveling out at around $55-57 per barrel.
The below matrix shows the six possibilities for supply and demand in the second half of 2017 and the resulting over/undersupply. Oversupply is positive and undersupply is negative.
Table 6: Production/Demand Oversupply 2017 (mb/d)
|
Production Surplus
|
Production: 97.94
|
Production: 99.72
|
Production equals demand
|
|
Demand: 98.32
|
-0.38
|
1.40
|
0.0
|
|
Demand: 98.50
|
-0.56
|
1.22
|
0.0
|
In the second half of 2017, there is a 6/10 chance of an undersupply of between 0.38mb/d and 0.56mb/d. This would decrease stocks and continue to slowly increase the market price by a similar amount to the first half of 2017. We could expect a Q4 2017 oil price of $59-62 and consider it likely that OPEC will wish to continue eating into the storage reserves to encourage a steady increase in price.
At the current supply and demand ratios, it would take 2 years to reach an oil storage stock level equal to the 5-year average. This may be a goal of OPEC. Therefore, it is very likely that OPEC would continue the agreement throughout 2017. By the end of 2017, oil stocks would remain between 283.2 million barrels and 196.16 million barrels over the 5-year average.
We can conclude that in Q1 and Q2 2017, there is an:
- 8/10 chance of an undersupply in oil of between 0.38mb/d and 0.56mb/d, resulting in a price increase of between $57 and $58.
In Q3 and Q4 2017, there is a:
- 6/10 chance of a continued undersupply between 0.38mb/d and 0.56mb/d, increasing the price above the June 2017 $57 and $58 price point - closer to between $61 and $63.
- 2/10 chance of equal supply/demand, maintaining the price at approximately the June 2017 level of $57.
- 1/10 chance of an oversupply between 1.22mb/d and 1.4mb/d, decreasing the price close to current levels, but still higher than Q4 2016 due to the price jump in Q1 and Q2 2017.
Throughout the year, there is a 1/10 chance of an extraneous event occurring which significantly changes the price of oil in an unexpected way. This would be an unforeseen drop in demand due to either Brexit, Trump and US demand or a further economic crisis. This would negate the decrease in supply and cause the price to either remain level through 2017 or drop further.
Disclosure: I/we have no positions in any stocks mentioned, and no plans to initiate any positions within the next 72 hours.
I wrote this article myself, and it expresses my own opinions. I am not receiving compensation for it. I have no business relationship with any company whose stock is mentioned in this article.
Additional disclosure: The use of this article is for educational and informational purposes only. NOT investment advice. None of the material presented in this article should be construed as investment advice (neither direct, explicit, or implied). It is strongly suggested and recommend that you do your own due diligence and/or consult a qualified financial advisor for any investment advice based on your situation.


.jpg)