


.jpg)

(Credit: businessfirstfamily.com)
Many will agree that 2016 was an interesting year for the market. As opposed to the usual "January Effect" of buying and bidding up prices, instead there was a market sell-off in early January. Nearing the end of January there appeared to be a turnaround. And then of course, there was the "Trump Bump" nearing the end of the year and into early 2017.
Indices did quite well. I usually track many of my strategies to the Russell 1000TR (large cap) or 3000TR (large and mid cap). The Russell 3000 returned 15.5% over the year at a maximum drawdown of 10% (Source: Portfolio123.com). Indexers should be quite happy with this result.
One of my buy and hold strategies is the low EV/EBIT strategy. This strategy screens for stocks with the lowest ratio of enterprise value,EV, to earnings before interest and taxes, EBIT. You can read a full description on the strategy here. For those not familiar with strategy, the EV/EBIT metric is similar to the price to earnings ratio P/E, however it takes into account several aspects that the P/E ratio does not (described at length in the linked article). This is a buy and hold strategy with a holding period of 1 year. You buy your 30 stocks, and simply hold for the period. After one year, rebalance by selling the holdings and buying new stocks passing the screen.
This is a value strategy. Low EV/EBIT stocks are essentially Buffett's "cigar butts"; dirty, discarded with maybe one last puff left.
If you bought stocks passing this screen on 01 Jan of 2016 in the US Large and Mid Cap stock universe, and held for the entire year of 2016, you would have achieved a return of 23% (Source: Portfolio123.com). Very impressive, and still outperforming the benchmark Russell 3000TR. This return is in line with historical returns of this strategy.
Timing is Everything
In previous articles (here and here) I have discussed how timing can play a significant role in buy and hold type strategies. Sometimes investing in a strategy with starting points of only days apart can make a dramatic difference to returns.
2016 was no different. My angle on SA is quantitative investing, and I also happen to "eat my own cooking". I am virtually 100% invested in quantitative strategies. One of my strategies is the low EV/EBIT strategy (US Large and Mid Cap Universe). In 2016, I took my positions on 20 Jan. This was not deliberate, and I did not know that the January sell-off was nearing its end. I did not use any elaborate algorithm to time the market (although this is possible in quant investing, perhaps more on that in a future article). I simply bought on the basis that I was in for the long haul, and that any short-term fluctuations would work out in the end.
The period from 20 Jan 2016 to one year later was particularly generous. The Russell3000TR returned an astonishing 26%, with only a drawdown of 6%. Index investors during this period would have been quite pleased.
What about the low EV/EBIT strategy? As the teaser headline boasts, this strategy returned a whopping 58.9%! This more than doubled the already impressive return of the Russell 3000TR. See the graph below for a comparison of the returns of the strategy and benchmark.
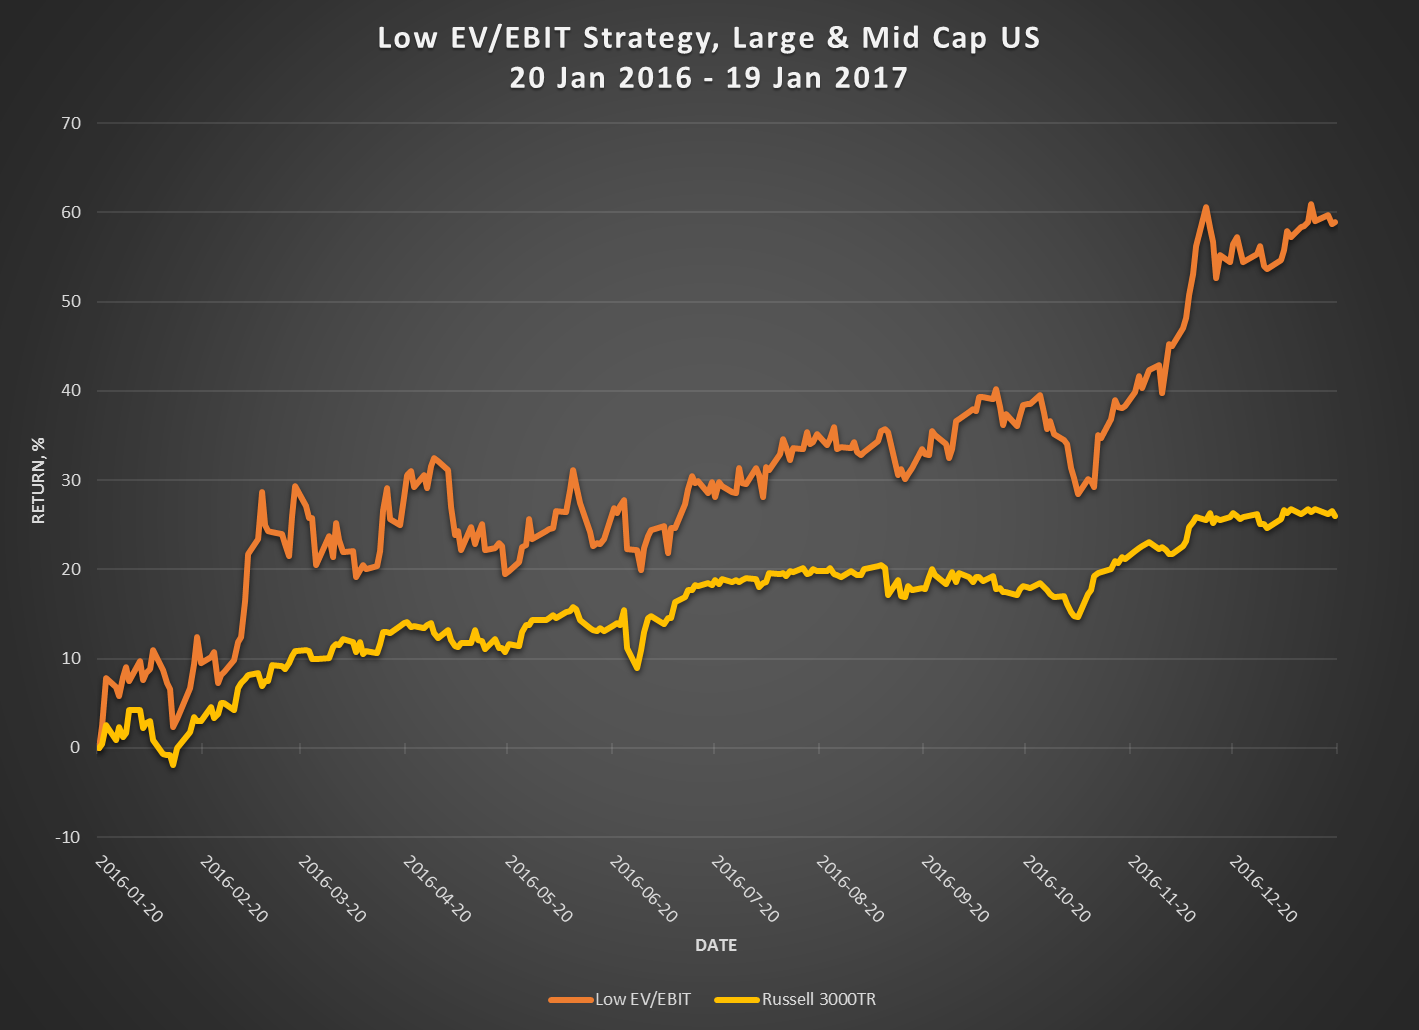
(Source: Portfolio123.com data and Author Graph)
As I said, there was no tricky timing strategy used here (I'll let you know when I develop one though!).
What Led To This Return?
Let's take a look at the stocks making up this portfolio. Stocks are sorted by return over the period, highest to lowest. EV and EBIT data are at time of purchase (20 Jan 2016).
|
Ticker |
Name |
Price, 20 Jan 2016 |
Price, 19 Jan 2017 |
% Change |
Mkt Cap ($M) |
Industry |
EV ($M) |
EBITTTM ($M) |
EV/EBIT |
|
McDermott International Inc. |
2.38 |
7.46 |
213.45 |
645.2 |
Oil & Gas Equipment & Services |
788.5 |
189.44 |
4.16 |
|
|
EP Energy Corp |
2.35 |
6.09 |
159.15 |
699.13 |
Oil & Gas Exploration & Production |
5,602.13 |
1,349.00 |
4.15 |
|
|
Argan Inc |
27.9 |
70.85 |
153.99 |
429.06 |
Construction & Engineering |
149.04 |
73.88 |
2.02 |
|
|
Alliance Resource Partners LP |
9.16 |
22.63 |
147.04 |
892.49 |
Coal & Consumable Fuels |
1,827.46 |
489.36 |
3.73 |
|
|
Greenbrier Companies Inc. (The) |
19.73 |
48.28 |
144.76 |
638 |
Construction & Farm Machinery & Heavy Trucks |
1,061.61 |
485.64 |
2.19 |
|
|
Atwood Oceanics Inc. |
5.88 |
14.17 |
140.99 |
392.45 |
Oil & Gas Drilling |
1,964.41 |
607.51 |
3.23 |
|
|
Exterran Corp |
13.6 |
31.27 |
129.93 |
491.66 |
Oil & Gas Equipment & Services |
458.96 |
158.39 |
2.9 |
|
|
Cemex SAB de CV |
3.79 |
7.92 |
109.06 |
5,809.21 |
Construction Materials |
6,519.86 |
1,491.21 |
4.37 |
|
|
Outerwall Inc |
28.99 |
52* |
79.38 |
521 |
Specialty Stores |
1,170.78 |
318.58 |
3.67 |
|
|
Multi-Fineline Electronix Inc |
13.41 |
23.09* |
72.18 |
344.21 |
Electronic Manufacturing Services |
175.68 |
49.45 |
3.55 |
|
|
China Yuchai International Ltd |
8.01 |
13.61 |
69.86 |
334.98 |
Construction & Farm Machinery & Heavy Trucks |
373.83 |
161.57 |
2.31 |
|
|
BP Prudhoe Bay Royalty Trust |
17.65 |
29.4 |
66.55 |
470.37 |
Oil & Gas Exploration & Production |
469.37 |
153.8 |
3.05 |
|
|
HP Inc |
9.2 |
14.68 |
59.62 |
18,235.60 |
Technology Hardware, Storage & Peripherals |
25,850.60 |
8,381.00 |
3.08 |
|
|
Nevsun Resources Ltd |
2.21 |
3.5 |
58.53 |
465.49 |
Diversified Metals & Mining |
187.66 |
140.75 |
1.33 |
|
|
Bridgepoint Education Inc |
6.74 |
10.24 |
51.93 |
314.07 |
Education Services |
24.91 |
29.21 |
0.85 |
|
|
Sasol Ltd |
20.74 |
31.21 |
50.5 |
15,304.69 |
Integrated Oil & Gas |
14,846.97 |
3,790.70 |
3.92 |
|
|
Enanta Pharmaceuticals Inc |
25.5 |
33.7 |
32.16 |
525.2 |
Biotechnology |
380.75 |
124.15 |
3.07 |
|
|
Sanderson Farms Inc |
72.03 |
94.26 |
30.86 |
1,681.42 |
Packaged Foods & Meats |
1,494.76 |
336 |
4.45 |
|
|
ENSCO Plc |
8.98 |
11.6 |
29.17 |
2,426.17 |
Oil & Gas Drilling |
7,249.76 |
1,747.80 |
4.15 |
|
|
Changyou.com Ltd |
18.77 |
23.93 |
27.49 |
1,014.11 |
Home Entertainment Software |
456.11 |
211.67 |
2.15 |
|
|
Westlake Chemical Partners LP |
18.07 |
20.87 |
15.49 |
528.21 |
Commodity Chemicals |
1,447.50 |
362.58 |
3.99 |
|
|
Alon USA Energy Inc |
10.52 |
11.85 |
12.6 |
856.5 |
Oil & Gas Refining & Marketing |
1,214.33 |
292.06 |
4.16 |
|
|
Net 1 Ueps Technologies Inc |
10.57 |
11.9 |
12.58 |
515.82 |
Data Processing & Outsourced Services |
448.29 |
126.61 |
3.54 |
|
|
Molina Healthcare Inc. |
53.39 |
58.37 |
9.33 |
3,015.71 |
Managed Health Care |
317.29 |
407.15 |
0.78 |
|
|
RPX Corp |
10.19 |
10.99 |
7.85 |
561.82 |
Research & Consulting Services |
201.18 |
68.6 |
2.93 |
|
|
GameStop Corp. |
23.92 |
22.74 |
-4.95 |
2,689.64 |
Computer & Electronics Retail |
2,854.34 |
659 |
4.33 |
|
|
Cal Maine Foods Inc |
46.37 |
42.75 |
-7.8 |
2,395.17 |
Packaged Foods & Meats |
2,005.89 |
524.84 |
3.82 |
|
|
GoPro Inc |
10.18 |
9.29 |
-8.74 |
1,576.03 |
Consumer Electronics |
1,062.92 |
269.73 |
3.94 |
|
|
PDL BioPharma Inc |
2.86 |
2.28 |
-20.31 |
507.08 |
Biotechnology |
608.82 |
455.1 |
1.34 |
|
|
Lannett Co Inc. |
32.75 |
19.95 |
-39.08 |
1,240.67 |
Pharmaceuticals |
1,019.36 |
231.27 |
4.41 |
(Source: Portfolio123.com and Author Table)
The first thing that should jump out at you is how many stocks achieved returns of more than 100% over the period. McDermott International actually broke the 200% threshold. Many of these overachievers are from the oil and gas sector, but not all.
Overall, oil and gas firms take the majority, just over 25%. Construction related firms make up just over 10% of the portfolio. Only one mining company made the list, or two if you include coal.
The other notable feature of this performance is that there were only 5 stocks out of the 30 (1/6 th) that actually lost value. Generally you would expect more stocks to lose value over the period.
Two of the firms were acquired over 2016. Multi-Fineline Electronix Inc was acquired by Chinese hardware manufacturer Suzhou Dongshan Precision Manufacturing Co. Ltd (source), and Outerwall by alternative asset management firm Apollo (APO)(source). Both were acquired at generous premiums relative to the date the deals were announced. This worked out in our portfolio nicely; prices noted in the table above are the acquisition prices, once the deals closed (marked by *).
And then there is, of course, the tailwinds of the "Trump Bump", which lifted much of the market in later 2016 and early 2017. Looking at the graph however, note that our portfolio had a good lead on the benchmark Russell 3000TR almost right out of the gate. The effects of Trump only added to this gap near the end of 2016.
Keeping Things in Perspective
It is very tempting to see these results and assume that this strategy will perform just as well in the next 12 months. Historically this strategy has outperformed over time, and has had periods of significant outperformance. Research has also found that after very impressive returns from quant strategies, the returns tend to diminish for a period. You can see this for 5 year returns in the Large & Mid Cap returns for the strategy:
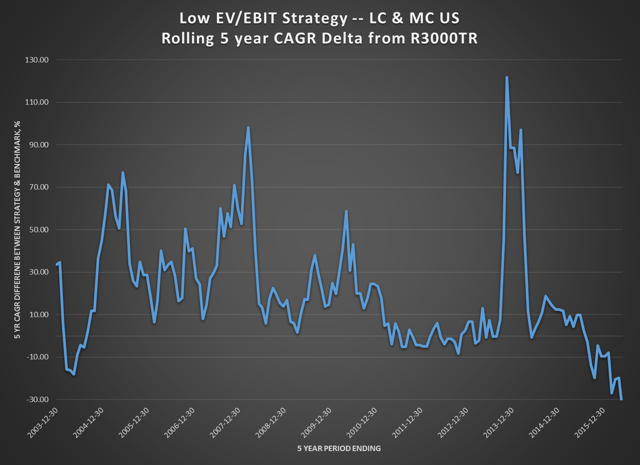
(Source)
Performance in the strategy has been dropping off since 2013. Could 2016 mark the beginning of a new "winning" phase, or will this recent outperformance be followed by underperformance? Time will tell.
In investing, you have to expect the unexpected, while trying to protect yourself against any negative events. As the great Charlie Munger has noted to another great Howard Marks on investing:
It's not supposed to be easy. Anyone who finds it easy is stupid.
(Source) At first read, this statement is cheeky and almost condescending. You can take this a variety of ways. To me, it means that investing can be rife with bumps, twists and turns. It is a reminder to always keep your guard up, and work to hedge your bets as best you can.
This applies in our case in that it is a reminder that performance as we have witnessed should not be expected continuously. Managing one's expectations (and client's expectations if you manage other people's money) is important during the investing journey.
Until next time, Happy Investing!
For more articles on Quantitative Investing, follow me on Seeking Alpha!
Disclosure: I am/we are long AGX, ARLP, BPI, HPQ, NSU, SSL, UEPS.
I wrote this article myself, and it expresses my own opinions. I am not receiving compensation for it (other than from Seeking Alpha). I have no business relationship with any company whose stock is mentioned in this article.
Additional disclosure: I am a user of Portfolio123.com, and have included affiliate links above. If you choose to try out a free trial of the service and become a paid subscriber through my link, I will receive a nominal fee.


