


.jpg)
Welcome to the weekly oil storage report edition of Oil Markets Daily!
Summary
This week's EIA oil storage report, as expected, was a complete mess. US crude storage saw a build of 4.58 million bbls, while total US liquids stockpile rose 7.028 million bbls.
US production fell by 749k b/d, led by a drop of 783k b/d in the Lower 48 due to Hurricane Harvey resulting in shut-ins, while Alaska saw a production jump w-o-w of 34k b/d. Refinery throughput, also impacted severely by Harvey, saw a drop of 3.253 million b/d week over week. US crude imports, however, didn't decrease as much as we had previously expected coming in at 7.083 million b/d or just a decrease of 822k b/d.
Adjustment factor was also a total mess, coming in at -625k b/d accounting for -4.375 million bbls this week.
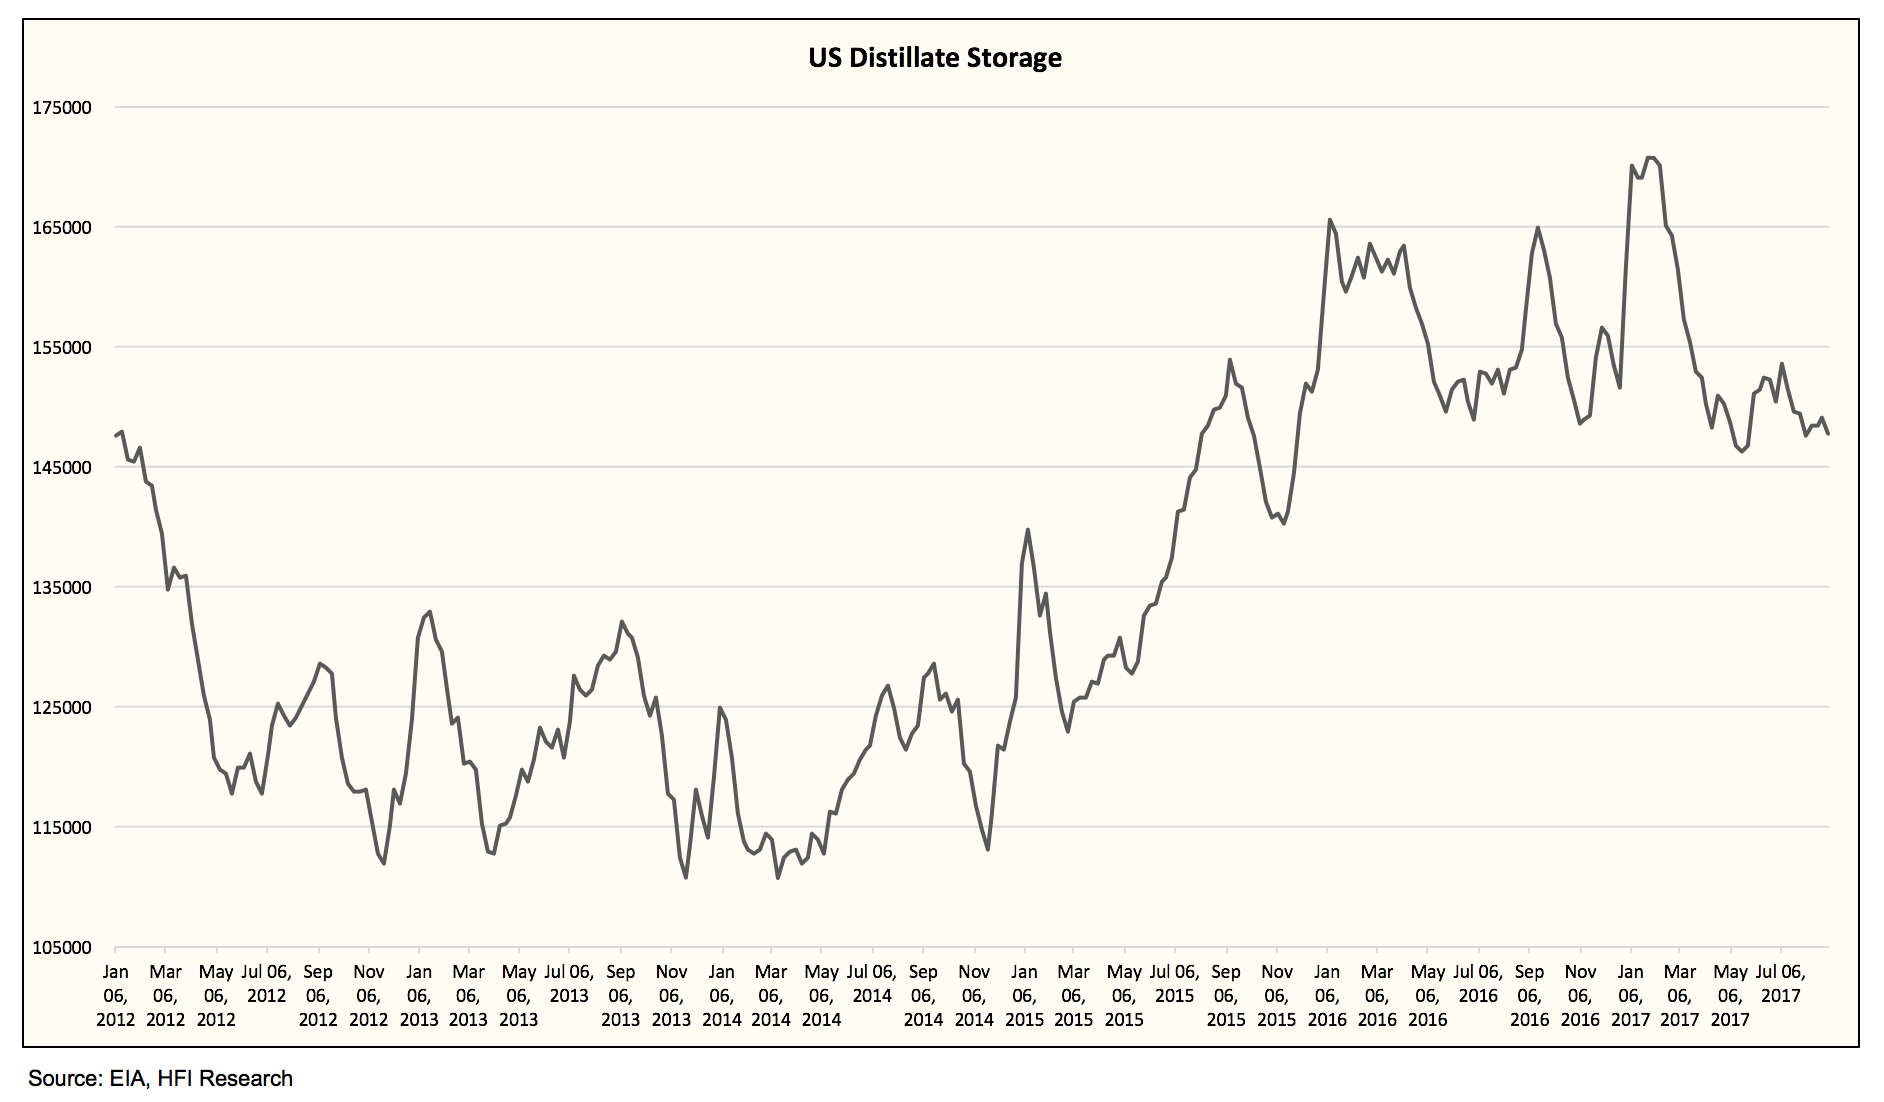
On the refined product end, gasoline storage saw a drop of 3.199 million bbls, while distillate saw a draw of 1.396 million bbls.
Overall, this week's storage report was very noisy, and readers shouldn't take this report very seriously. The build in crude storage and total liquids stockpile along with the drop in production and refinery throughput are all transitory. US crude storage will continue to decrease once things settle down and refineries return.
Crude
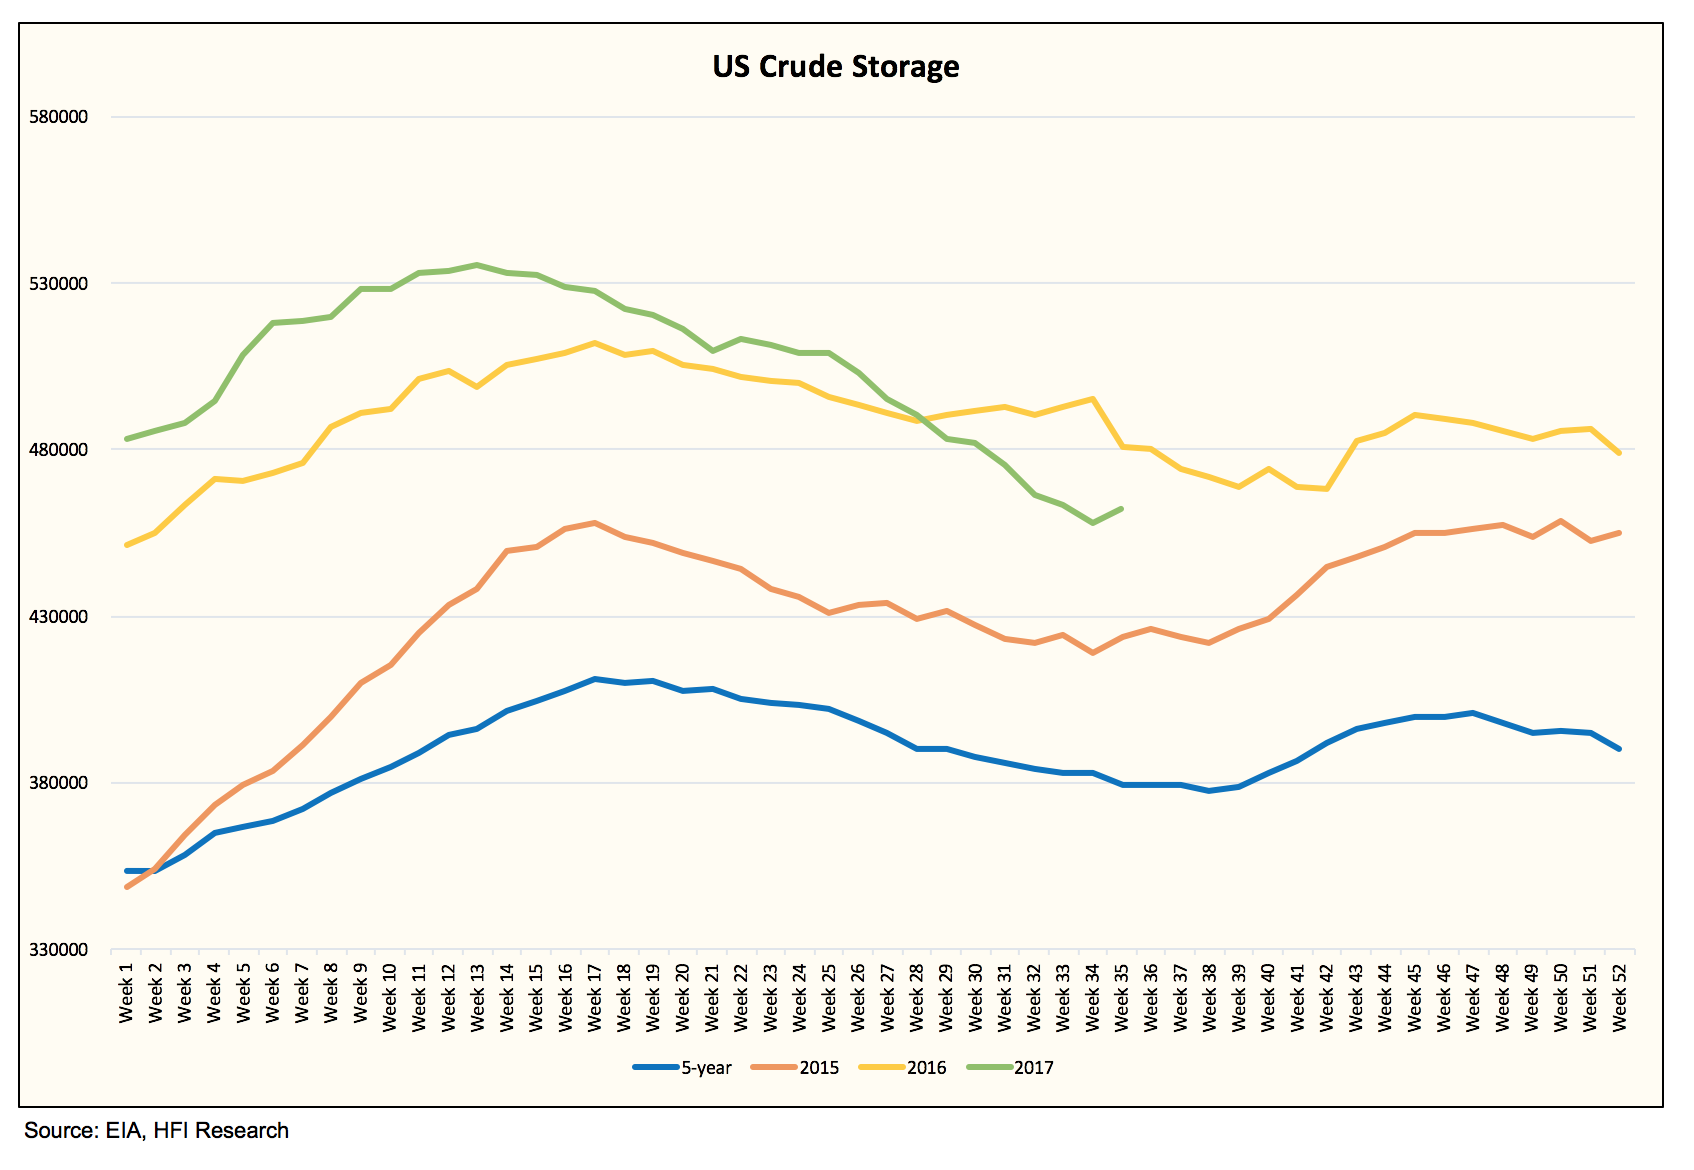
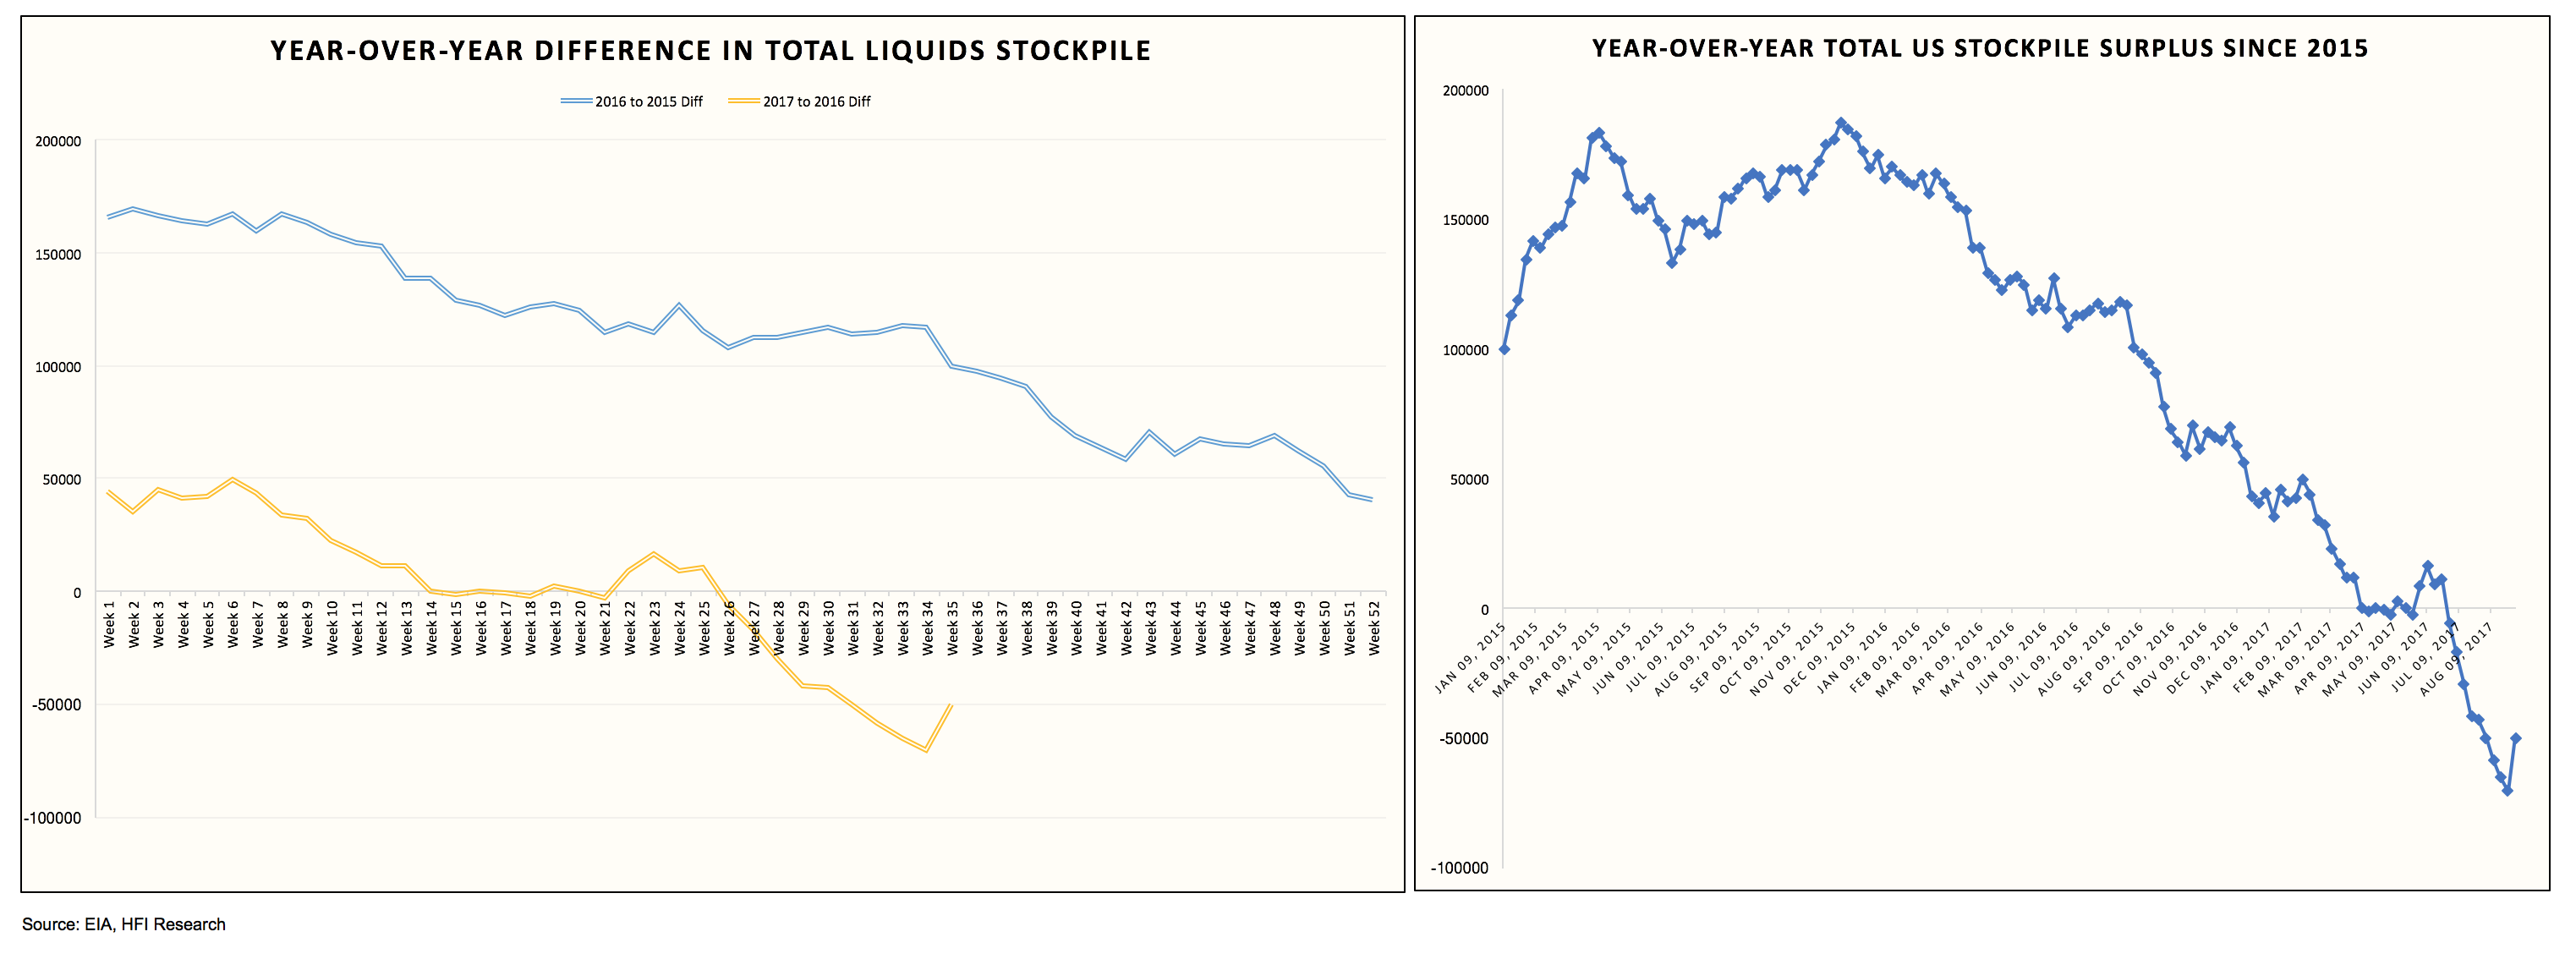
Crude storage saw a build of 4.58 million bbls w-o-w.
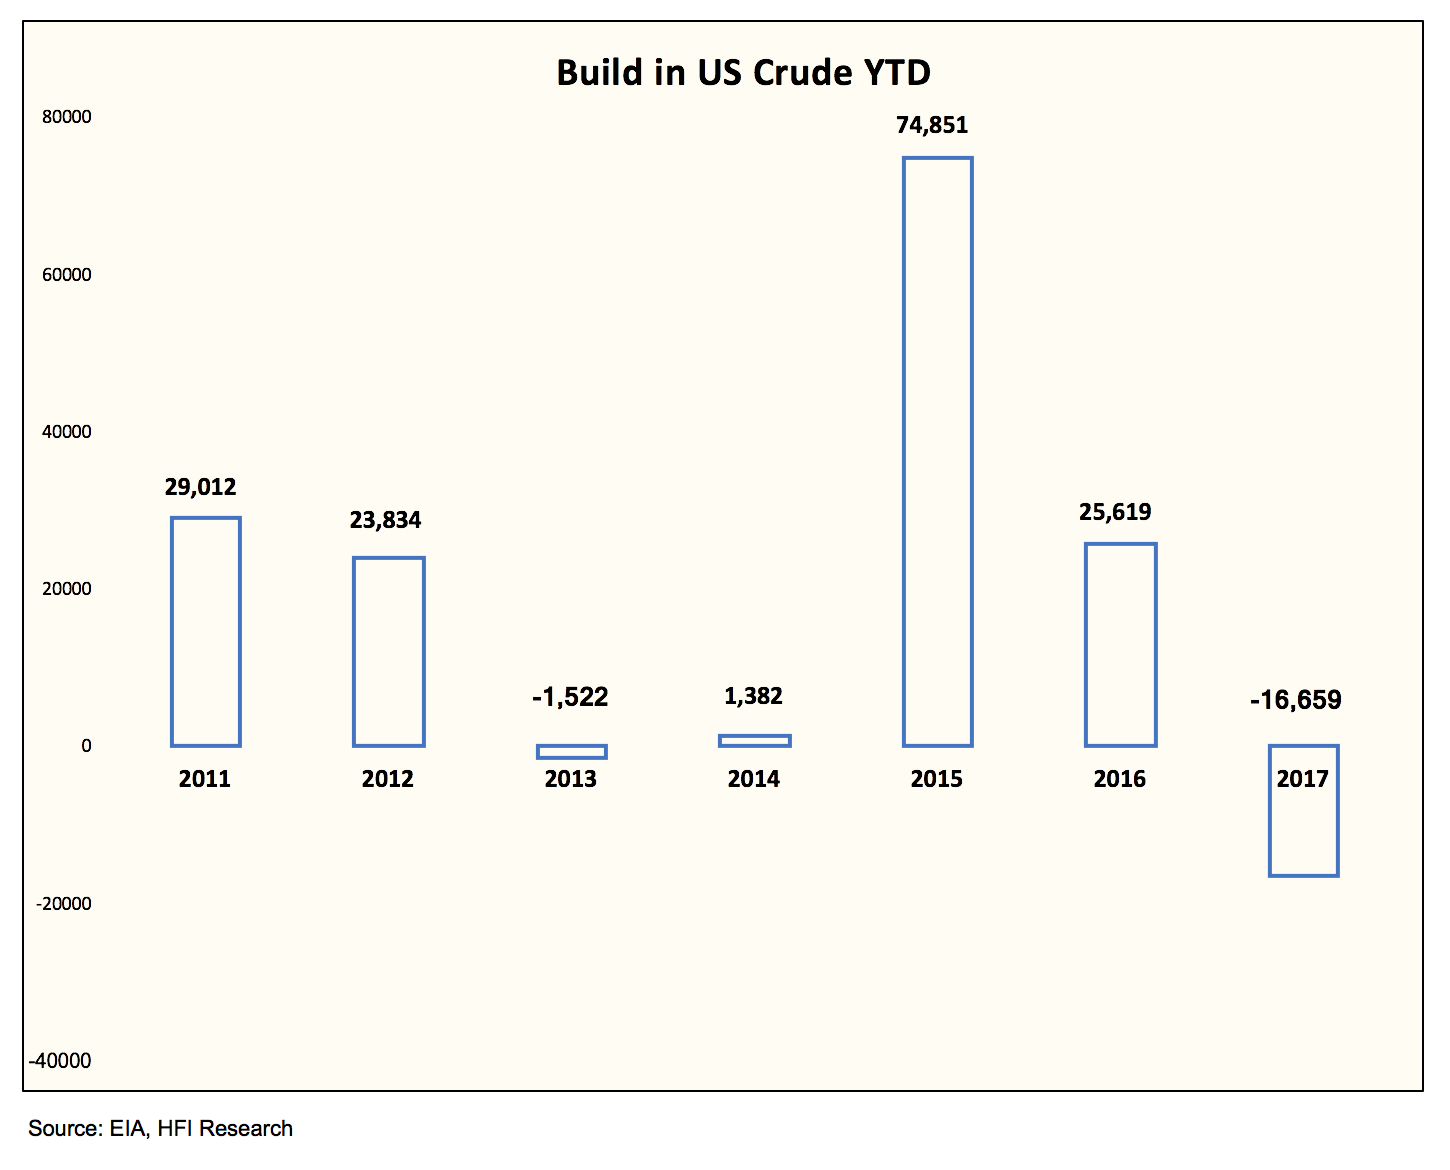
This brings YTD storage draw to -16.659 million bbls (excluding SPR).

As you can see in the y-o-y difference chart, this week normally sees a storage draw, but due to Harvey, this was not a "normal" storage report.
Despite the next few weeks exhibiting volatile figures, we maintain our stance that US crude storage will continue to decrease in the months ahead.
US Crude Production
US production saw a decrease of 749k b/d w-o-w, led by a decrease of 783k b/d in the Lower 48.

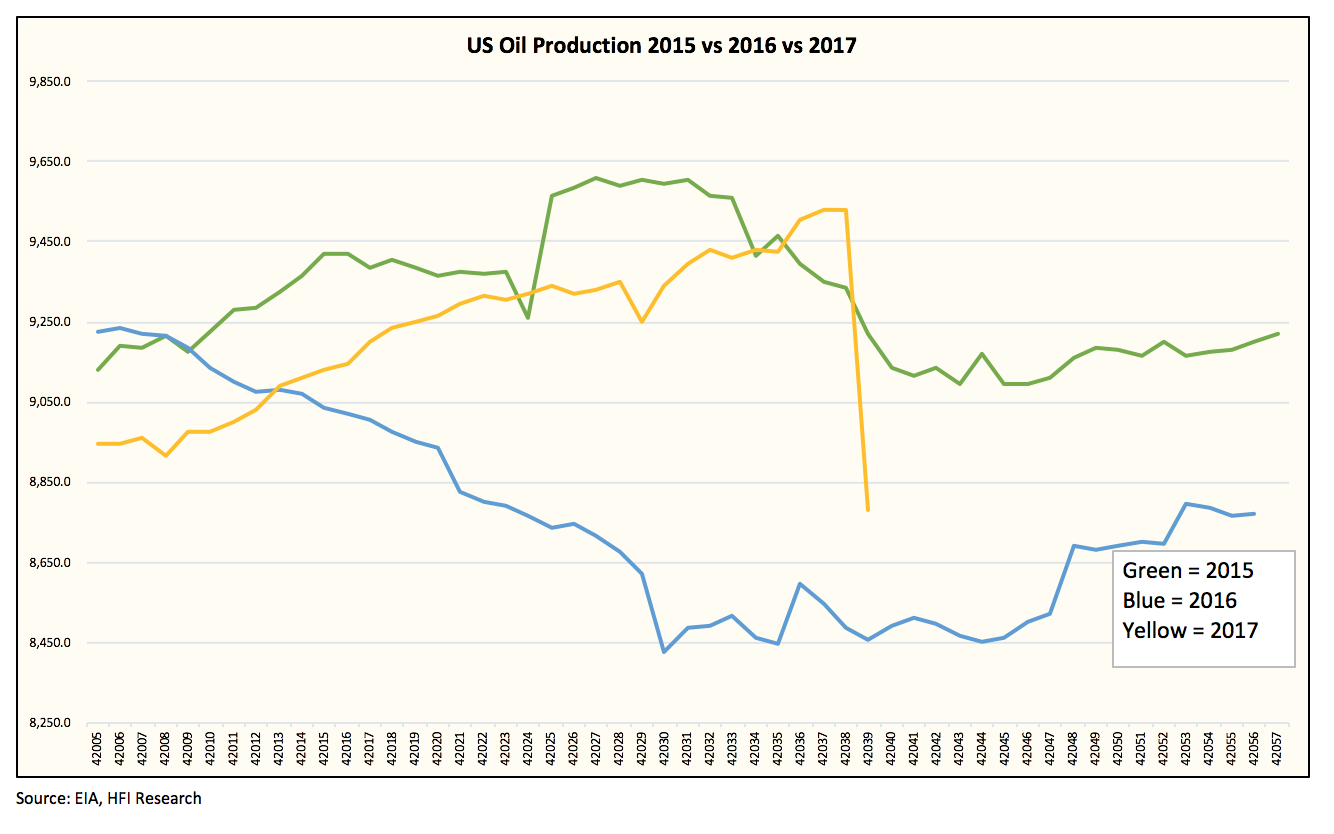
The production drop was expected as GOM and Eagle Ford production were impacted due to Hurricane Harvey. As to the extent of the outages, GOM production is already coming back online, while operators in the Eagle Ford hinting at more delays before getting production back-up. Harvey has also thrown a wrench into Eagle Ford operator drilling plan.
We expect production to rebound next week, but the extent of the rebound will be watched closely.
Refinery Throughput
Refinery throughput was also severely impacted due to the storm falling 3.253 million b/d w-o-w.
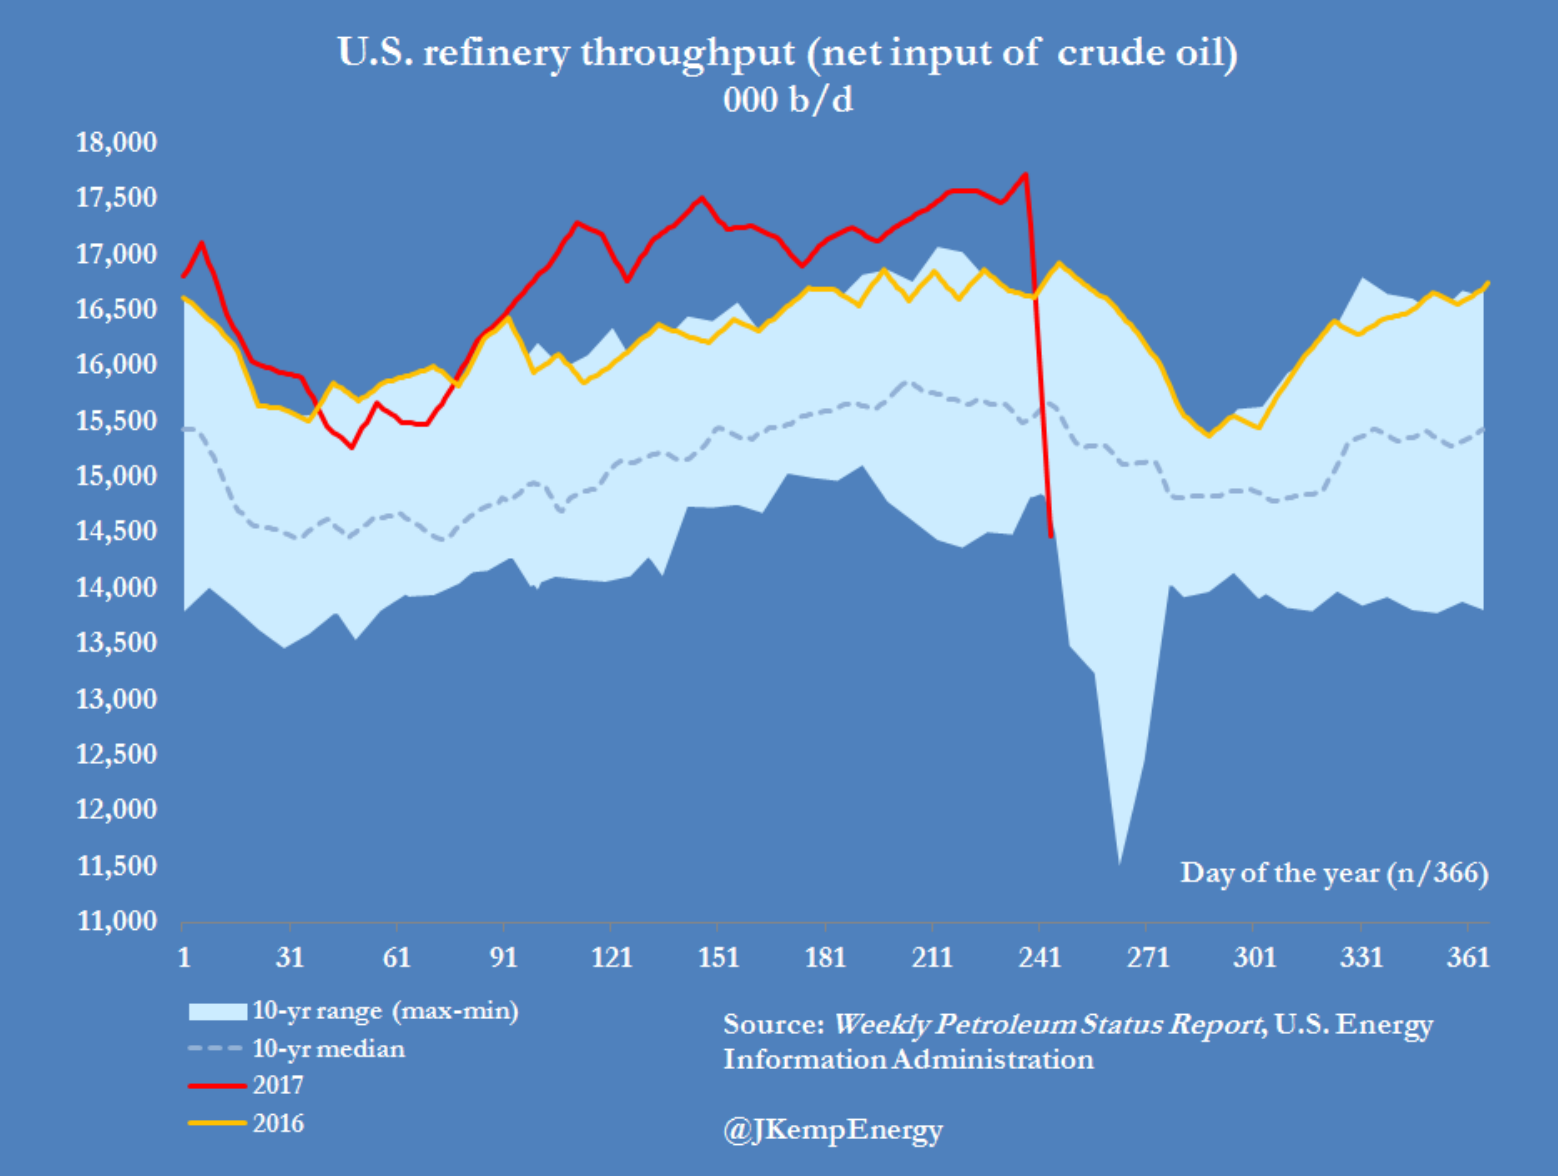
Source: John Kemp
This drop in demand is equivalent to 22.77 million bbls of lost demand for crude.
According to the latest updates, refineries are coming back faster than expected. Motiva, the largest refinery in the US, is expected to return this weekend with earlier reports saying the refinery was out for two weeks.
As refineries return, the typical refinery maintenance season will be somewhat delayed as crack spreads support high throughput for at least the next six weeks. Once we start to see more and more refineries come back, the impact on crude will be positive, while refined products will be pressured.
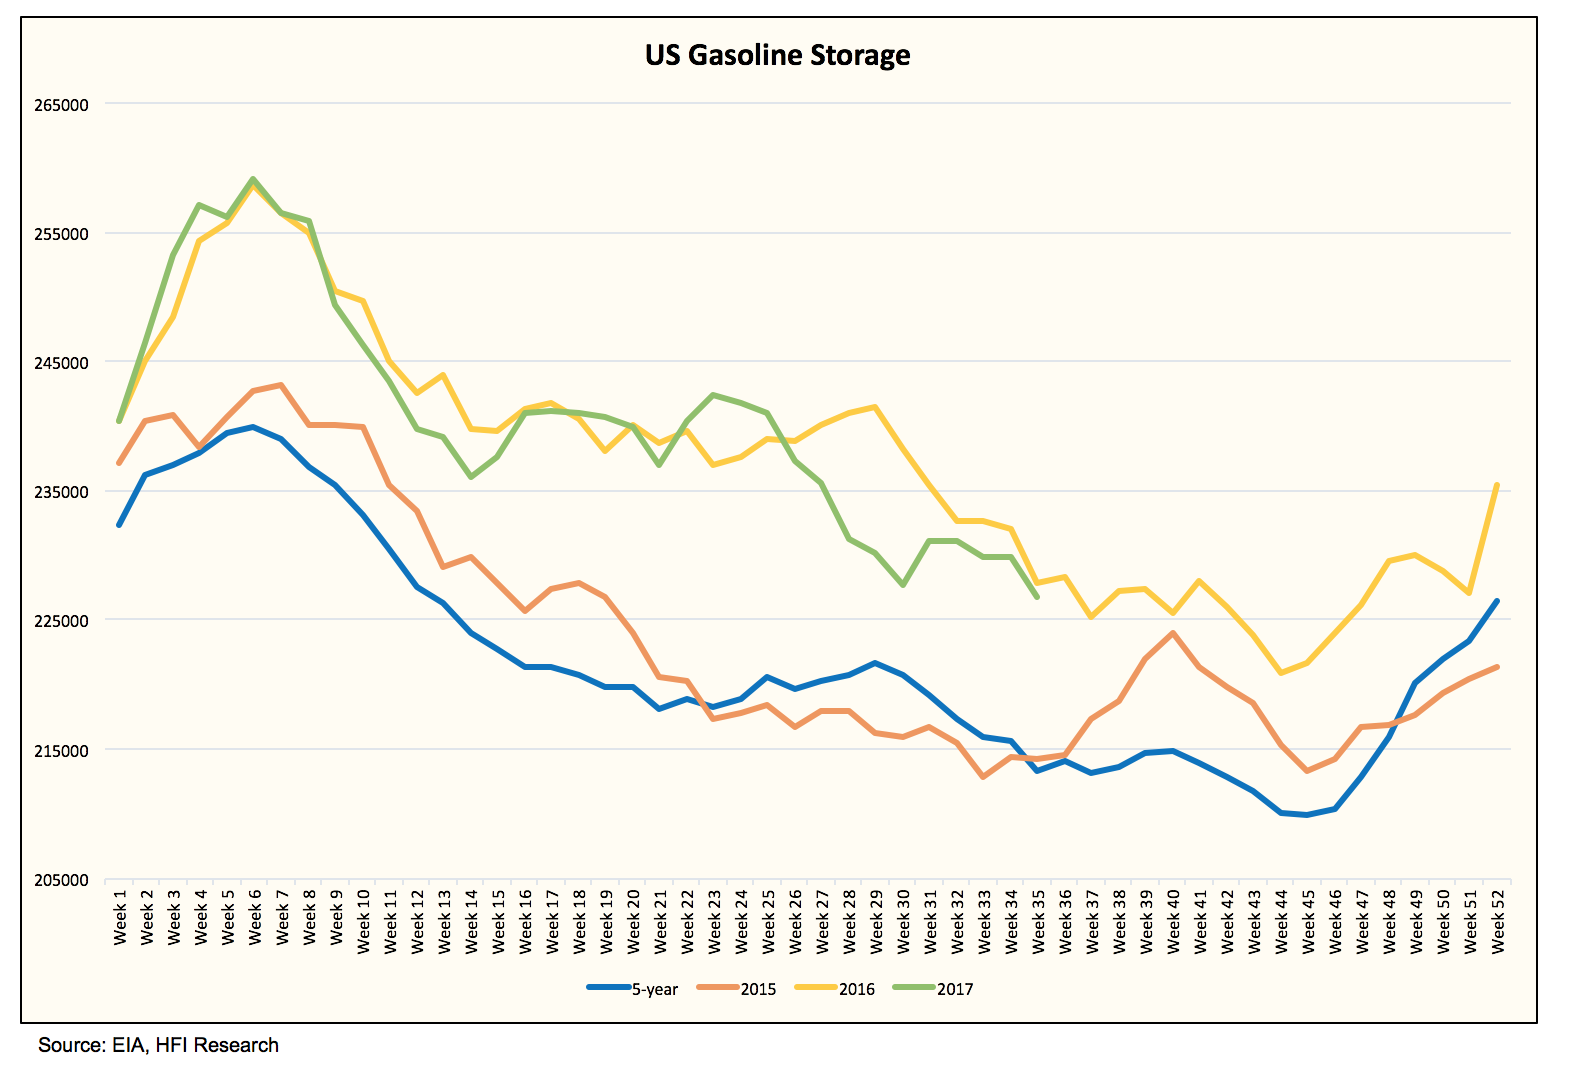
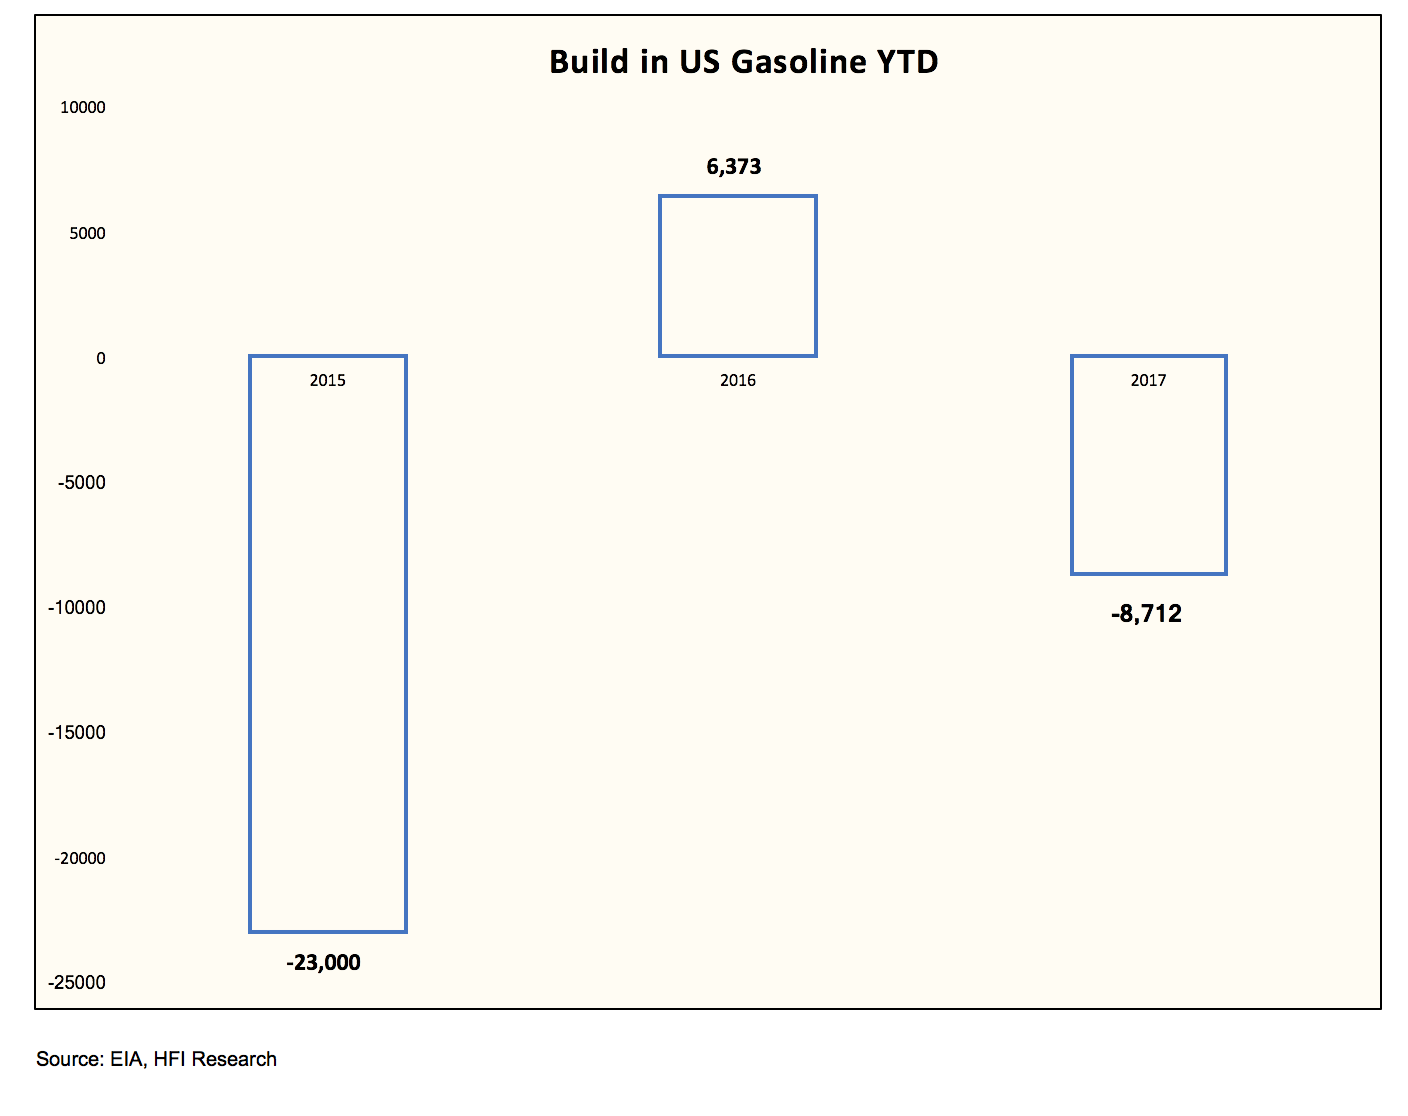
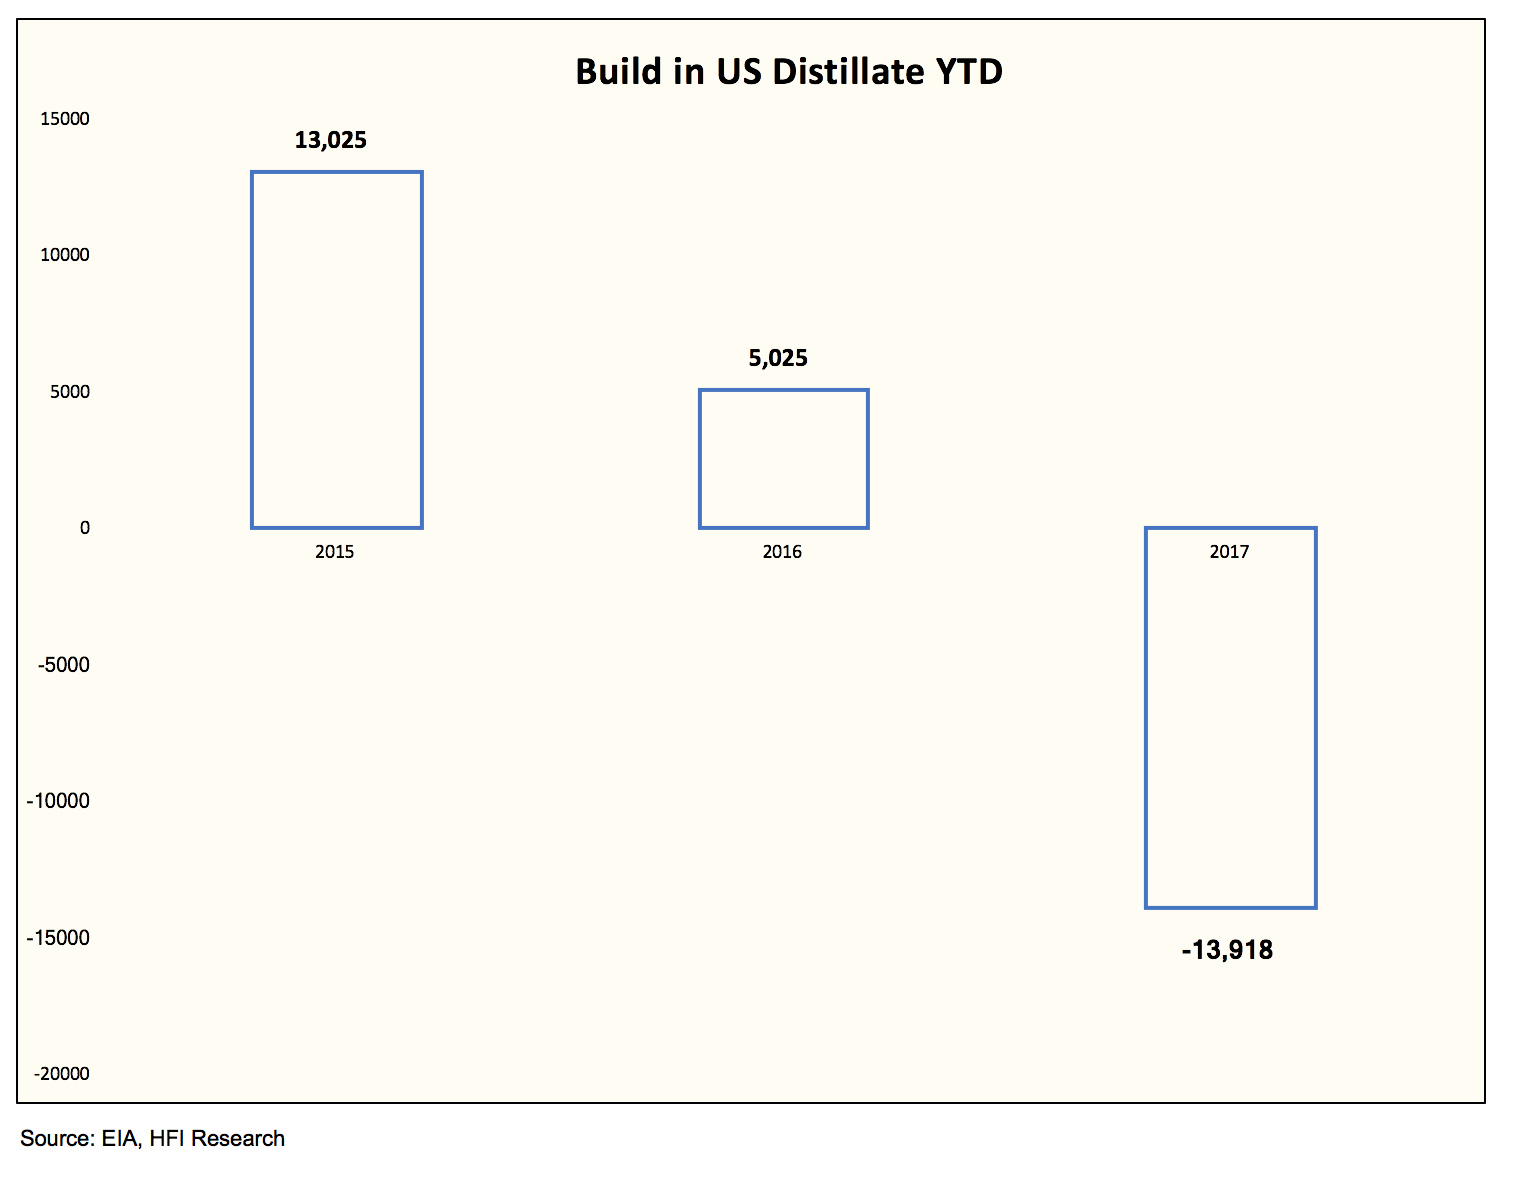
Gasoline and Distillate
Both refined product saw a drop in storage. Gasoline storage dropped 3.199 million bbls while distillate storage dropped 1.396 million bbls.


Total US Liquids Stockpile
Total liquids stockpile saw a build of 7.028 million bbls.
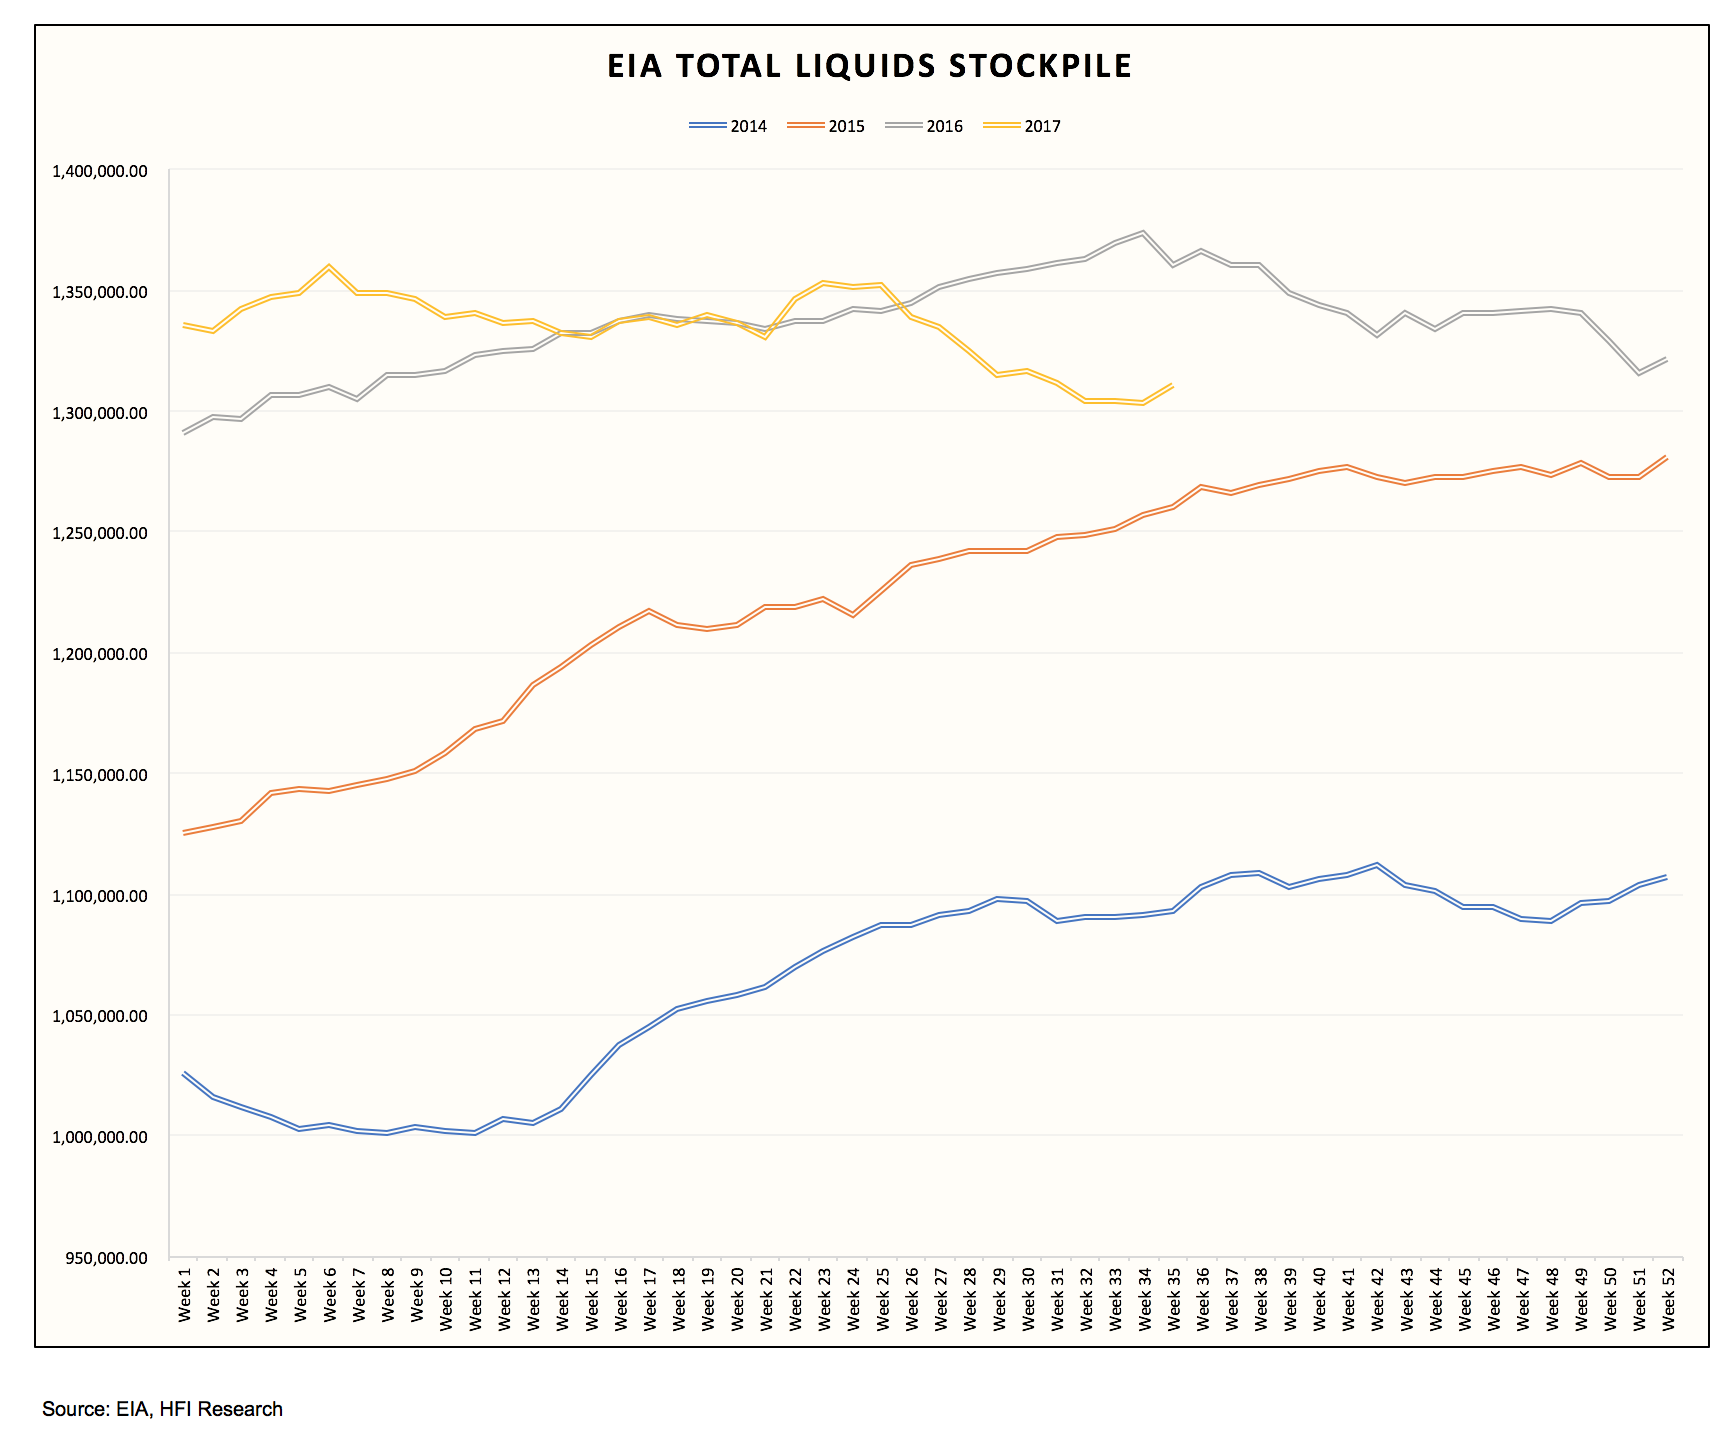
Despite the noisy weekly data, the trend remains clear that total liquids stockpile will continue to draw in the months to come.
Adjustment Factor
One of the noisiest variables in this week's storage report was the -625k b/d adjustment factor. To smooth out the noise in the weekly adjustment factors, here's a look at the eight-week moving average:
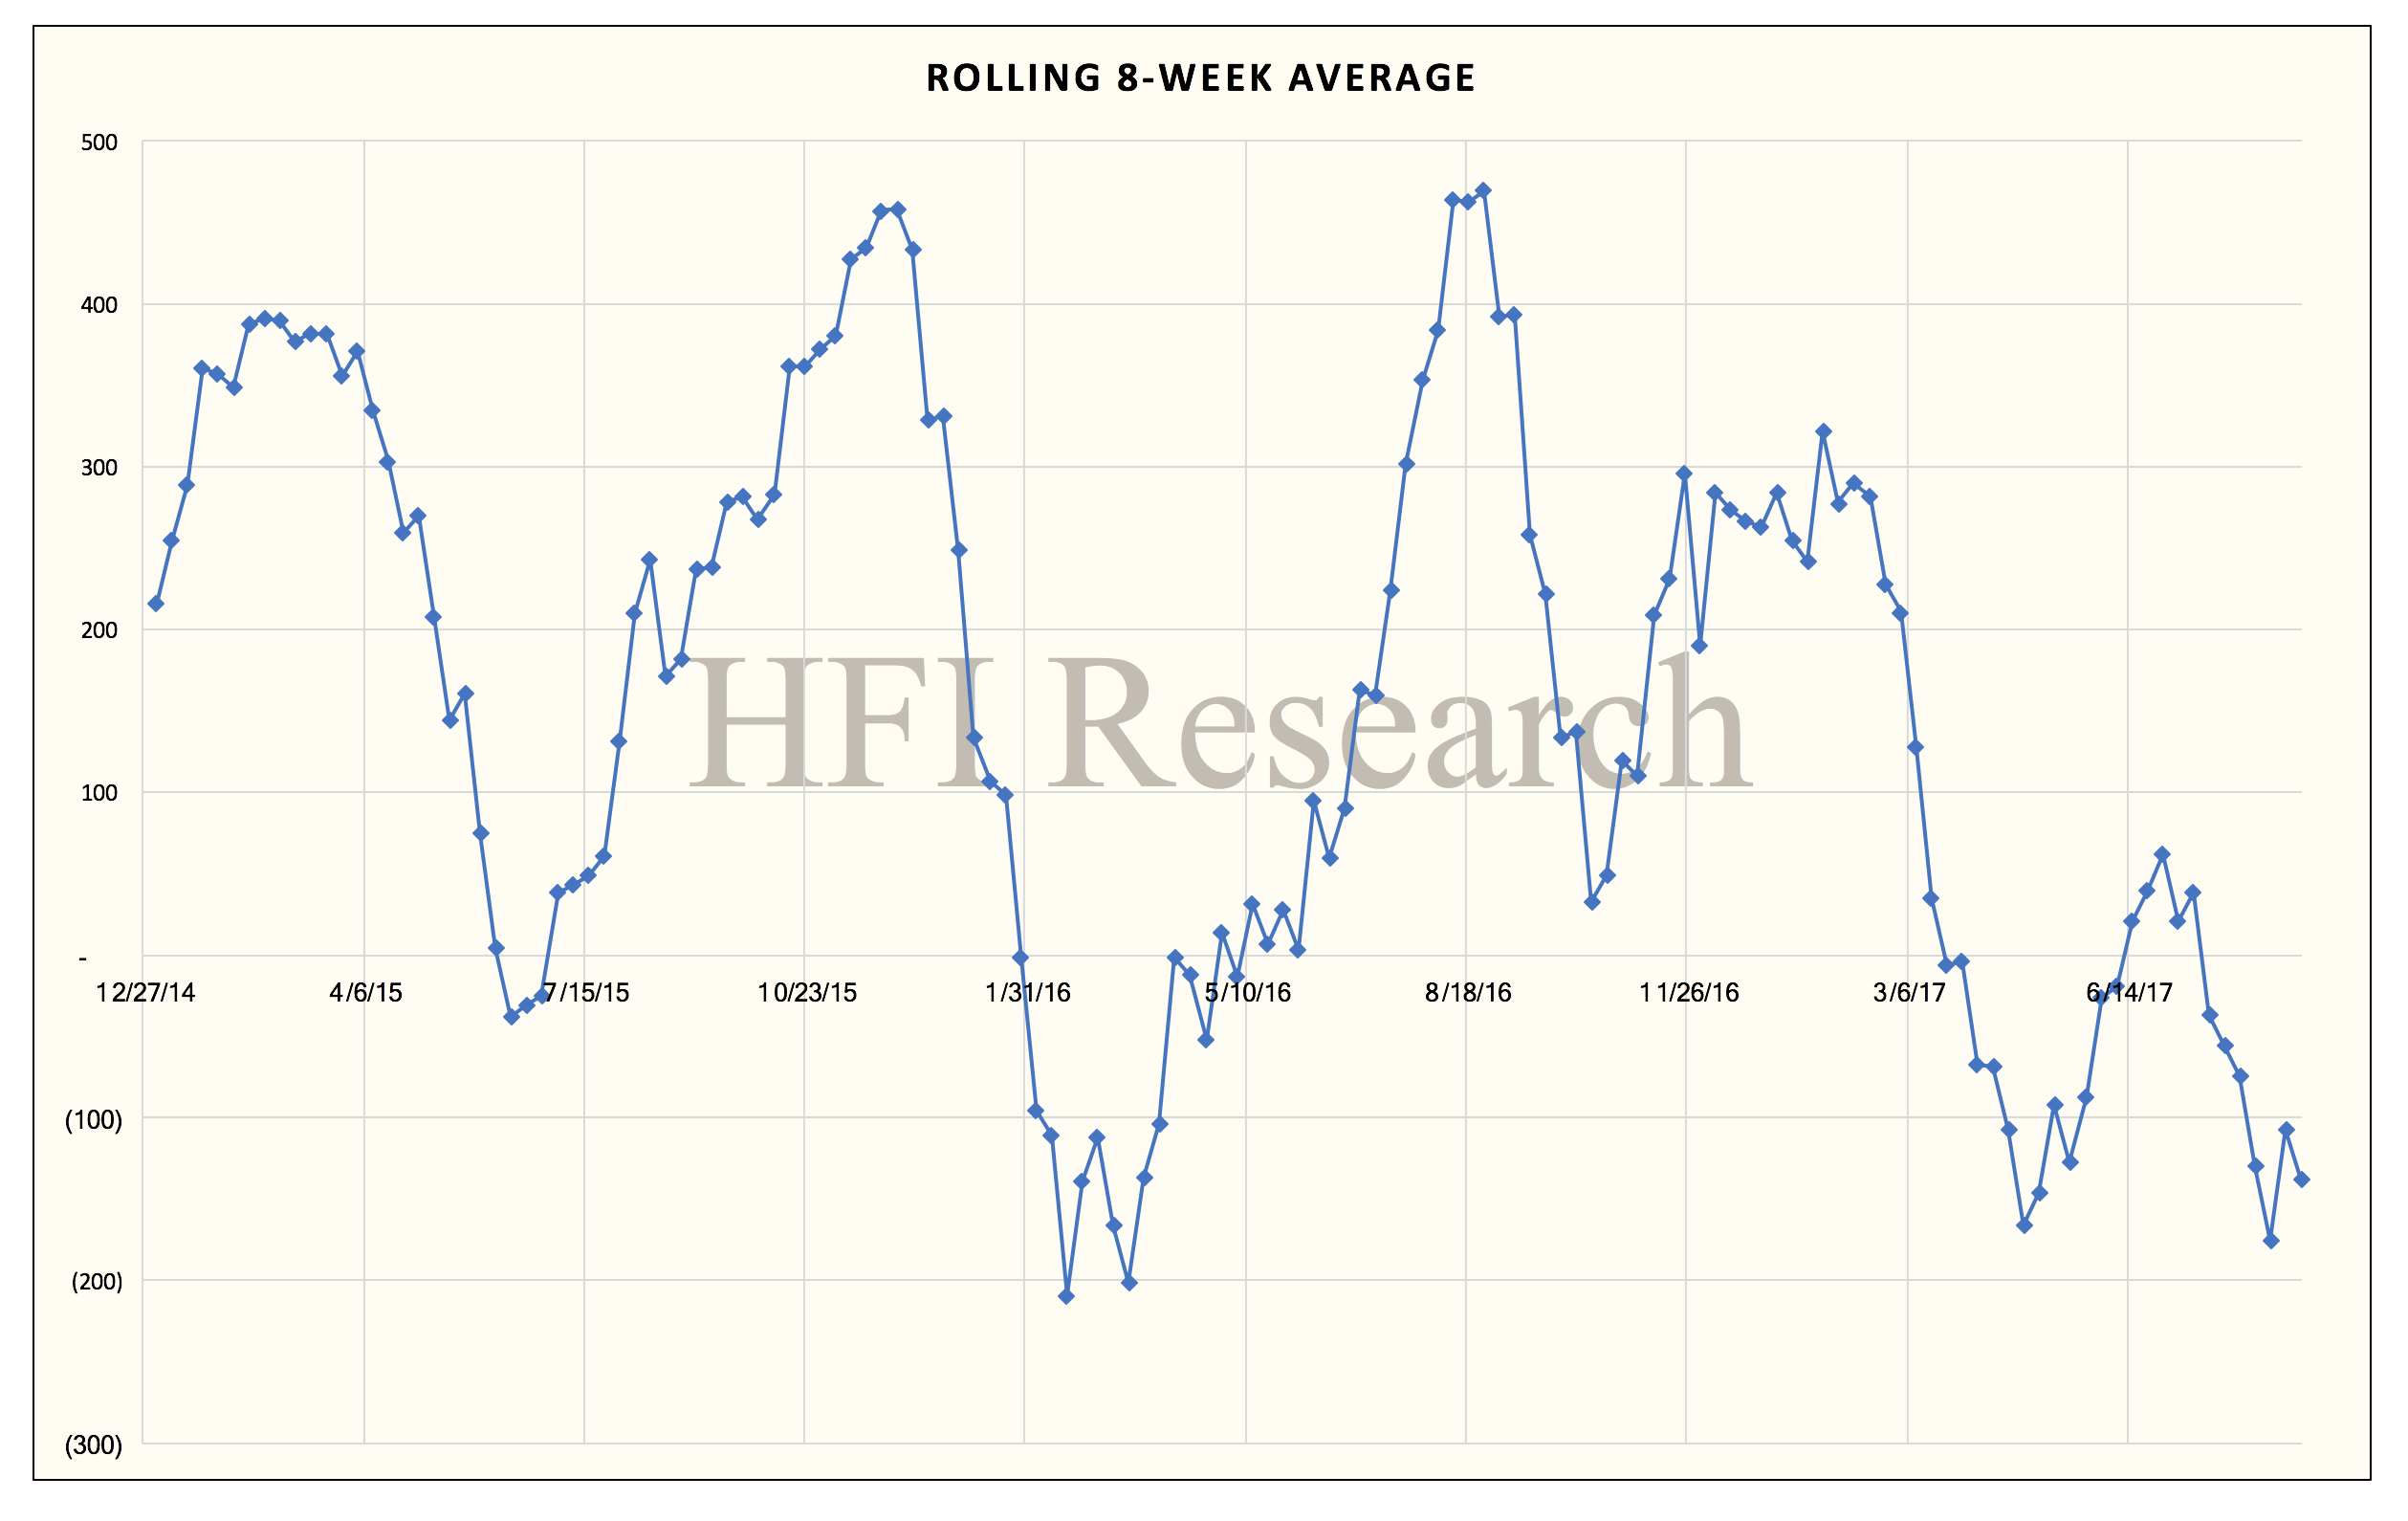
What does a downward trending adjustment factor imply?
A negative adjustment indicates either supply estimates are too high, or demand estimates are too low. A positive adjustment indicates either supply estimates are too low, or demand estimates are too high.
As you can see, the adjustment factor has been trending negative and remaining that way since the start of March. Incidentally, this was also at the same time when EIA's monthly production reports diverged materially from the weekly production estimates:
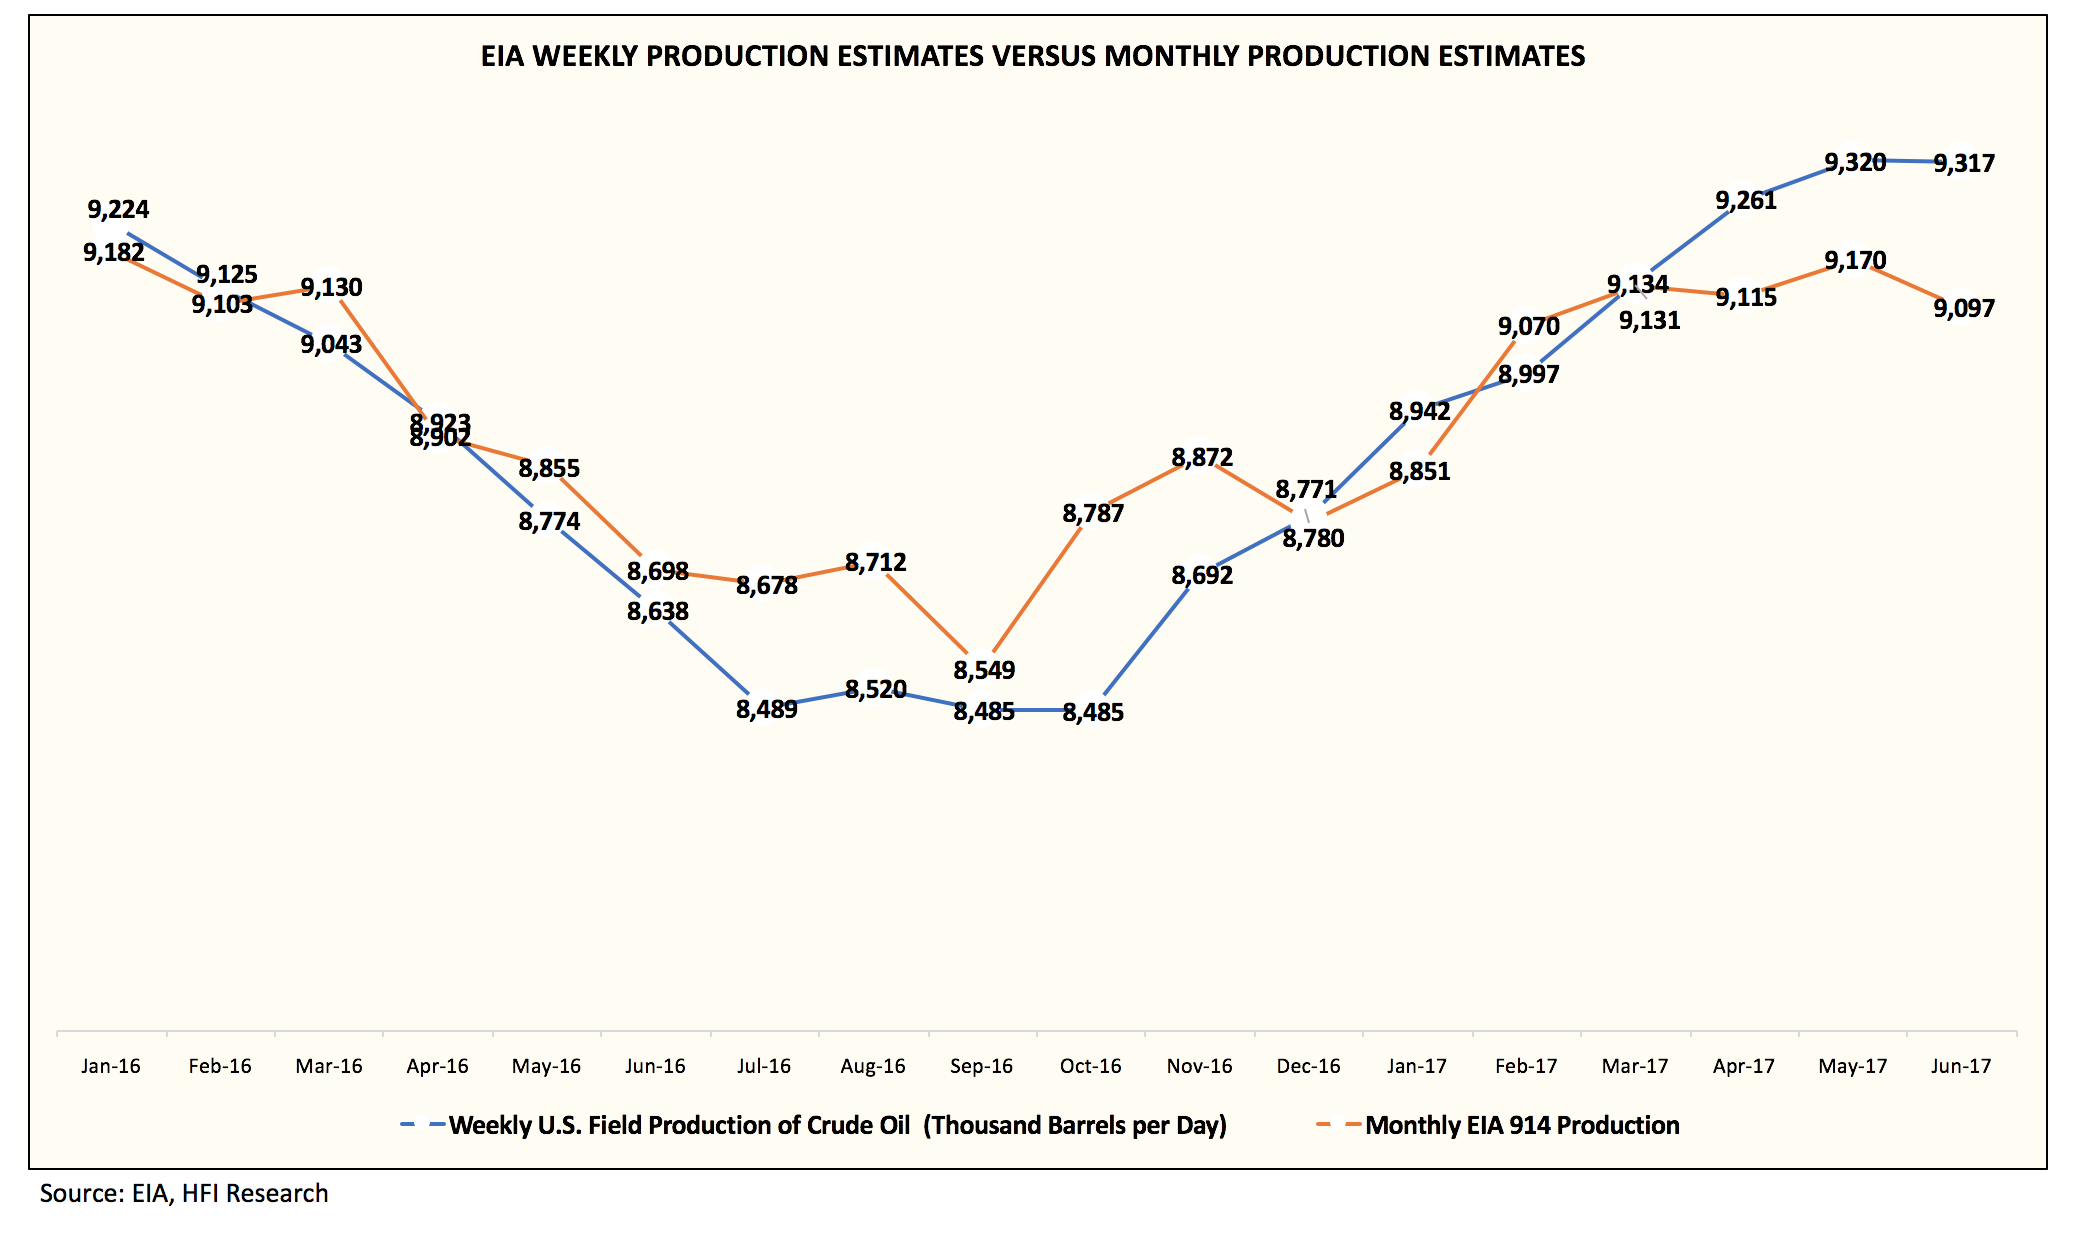
Coincidence? We think not.
Over the last three weeks, we have published numerous reports on the overestimation of US shale production, and for readers that have found our oil market reports to be insightful, we think you need to read what our exclusive reports said. To see our exclusive oil market research, please sign-up for HFI Research.
Disclosure: I/we have no positions in any stocks mentioned, and no plans to initiate any positions within the next 72 hours.
I wrote this article myself, and it expresses my own opinions. I am not receiving compensation for it (other than from Seeking Alpha). I have no business relationship with any company whose stock is mentioned in this article.


