One of the very few good reasons left to buy equities now is historic low interest rates. Broadly speaking, this is not a recent phenomena as it has been the case, from a valuation standpoint applying a more "normal" level of interest rates, for at least the last three years. Many are not making decisions based on hopes and dreams are aware of this fact, but nonetheless maintain a relatively high allocation toward equities out of necessity.
The necessity of a decent return in this historic low interest rate environment has resulted in a desperate chase for yield, often motivated by the current spread between earnings and bond yields.
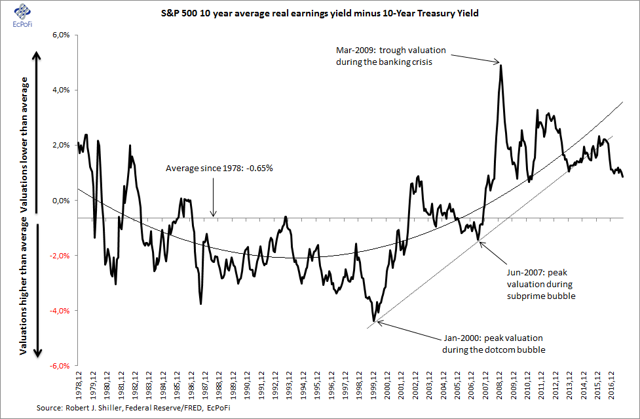 The chase for yield also demonstrates a lack of investment opportunities since newly printed money has acted more to drive up prices in the secondary market rather than fueling additions to capital goods. This has doubtlessly helped prolong the bull market in stocks as it has had a dampening effect on the business cycle.
But there is more to stock market valuations than the current level of interest rates. Further declines in nominal interest rates are limited, while the upside potential is tremendous in percentage terms. The best one can hope for is perhaps that rates remain near historical lows for a long period of time. Placing your bets solely on interest rates remaining low however requires a portion of delusion.
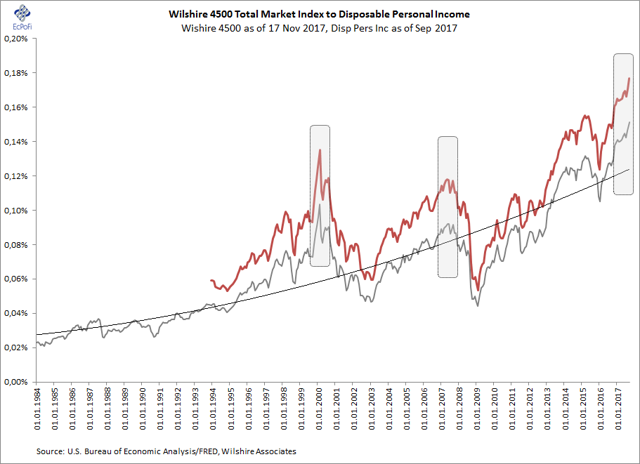
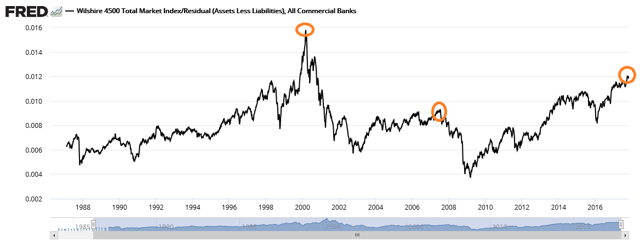
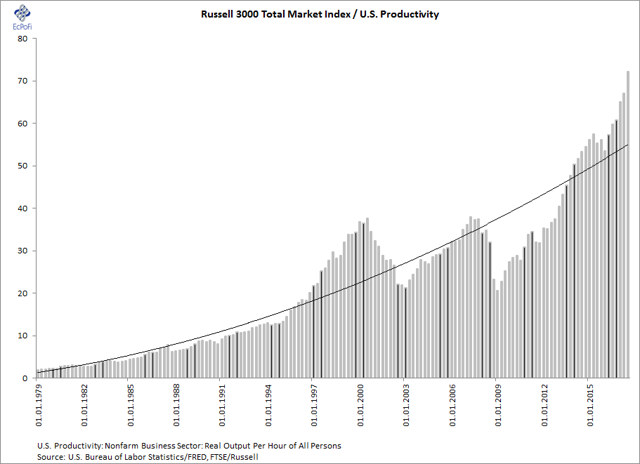
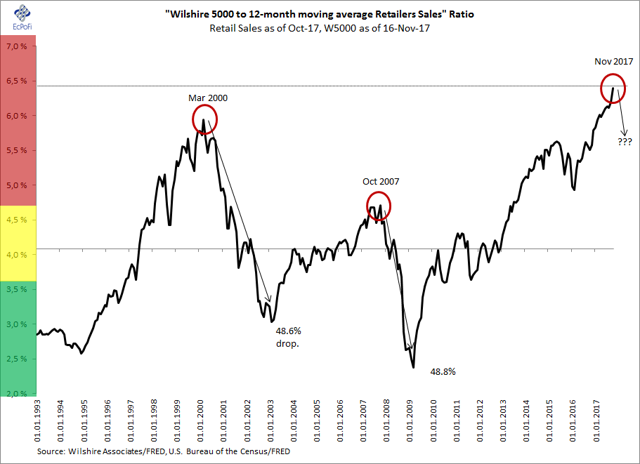
The nominator in any prudent appraisal of stock prices also matters, though it appears to play a minimal role these days as exposed in the charts below. Most of these charts have one thing in common - they compare stocks to a range of economic aggregates related to corporate sales and with it earnings. After all, earnings per share, no matter how "earnings" are calculated, cannot forever increase or even be maintained due to cost cutting and share repurchases alone.
Some of the charts published below were included in an unexpectedly popular article I published here on SA back in February this year - Ten Charts Demonstrating The 2017 Stock Market Euphoria, And One That Doesn't. Bulls should therefore be pleased as the only thing those charts have demonstrated is that the market has valued low interest rates and positive sentiment more than other fundamentals combined ever since. In other words, those charts look even worse today.
But for those of you concerned with probabilities and minimizing losses, and for those not posing in the glorious light of hindsight, the charts below should send shivers down your spine even more so today than nine months ago, especially given the savings disaster this year which have helped drive U.S. economic activity and stock prices.
My message however is unchanged from last time: "view and decide for yourself."
Chart 1. Wilshire 4500 & Disposable Personal Income
Chart 2. Wilshire 4500 & Commercial Banks' Equity
Chart 3. Russell 3000 & Productivity (Real Output per Hour)
Chart 4. Wilshire & Retailers Sales
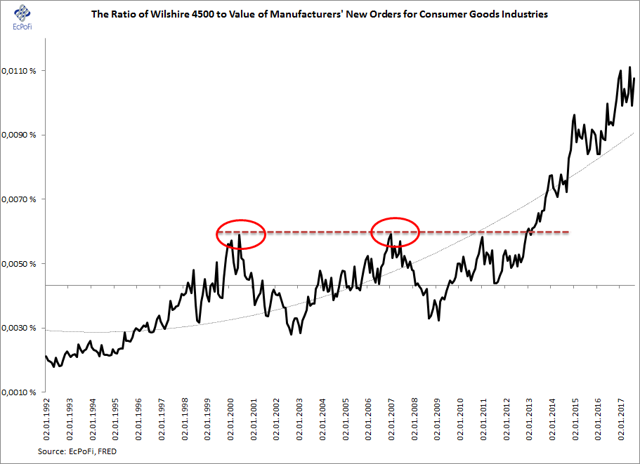
Chart 5. Wilshire 4500 & Manufacturers' New Orders
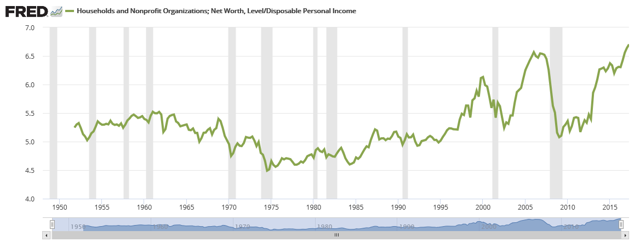
Chart 6. Households Net Worth & Disposable Personal Income
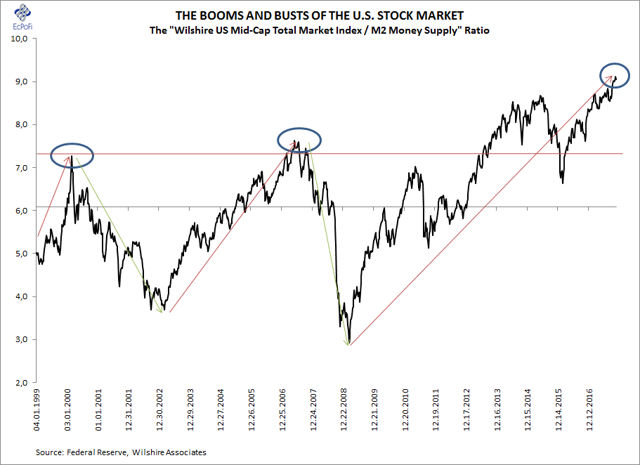
Chart 7. Wilshire US Mid-Caps & M2 Money Supply
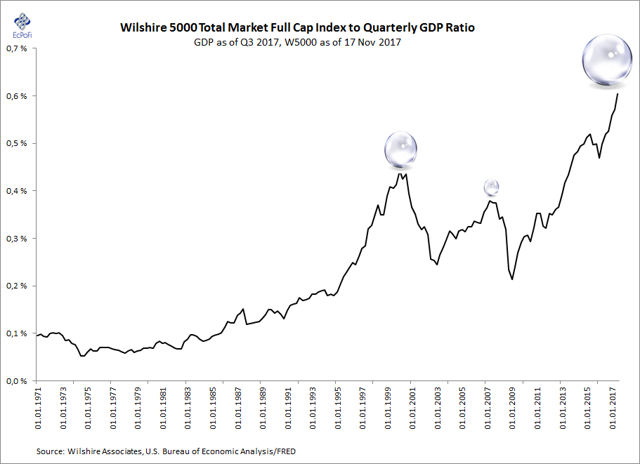
Chart 8. Wilshire 5000 & GDP
Chart 9. Russell 3000 & Personal Saving
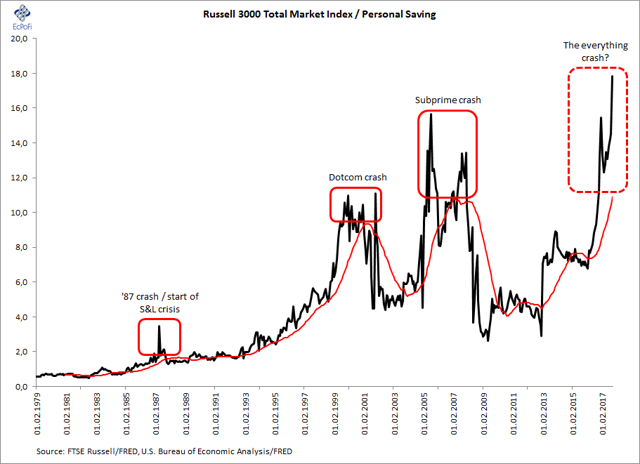
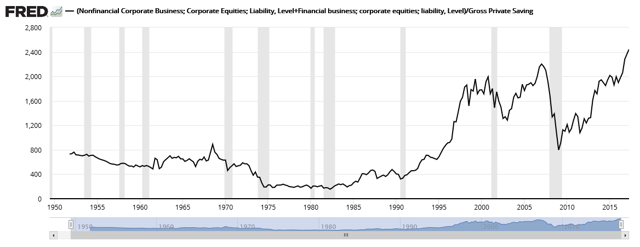
Chart 10. Market Cap of U.S. Companies & Gross Private Saving
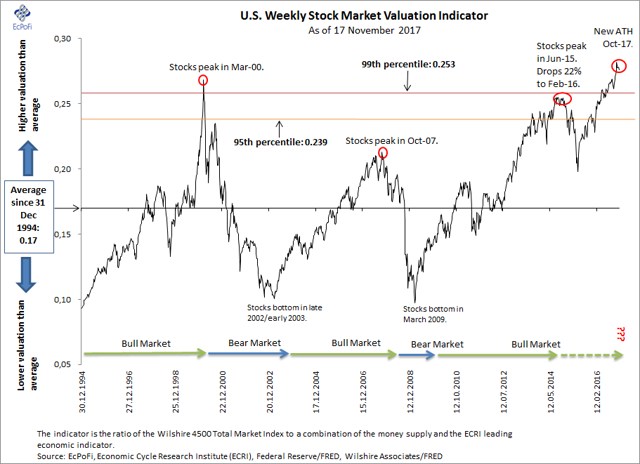
Chart 11. Wilshire 4500 compared to a combination of the Money Supply and a Leading Economic Indicator
Bonus Chart: The U.S. Stock Market Risk Indicator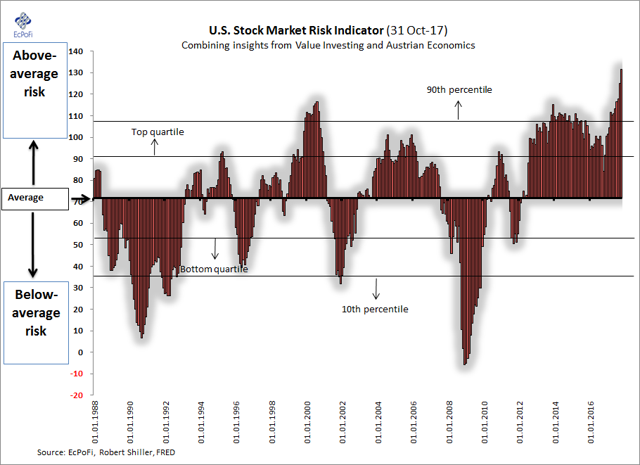
Disclosure: I am/we are long MYY.
I wrote this article myself, and it expresses my own opinions. I am not receiving compensation for it (other than from Seeking Alpha). I have no business relationship with any company whose stock is mentioned in this article.


