|
 Technical analysis is a financial term used to denote a security analysis discipline for forecasting the direction of prices through the study of past market data, primarily price and volume. Behavioral economics and quantitative analysis incorporate technical analysis, which being an aspect of active management stands in contradiction to much of modern portfolio theory. The efficacy of technical analysis is disputed by efficient market hypothesis since stock market prices are essentially unpredictable. Technical analysis is a financial term used to denote a security analysis discipline for forecasting the direction of prices through the study of past market data, primarily price and volume. Behavioral economics and quantitative analysis incorporate technical analysis, which being an aspect of active management stands in contradiction to much of modern portfolio theory. The efficacy of technical analysis is disputed by efficient market hypothesis since stock market prices are essentially unpredictable.
History
The principles of technical analysis are derived from hundreds of years of financial market data. Some aspects of technical analysis began to appear in Joseph de La Vega's accounts of the Dutch markets in the 17th century. In Asia, technical analysis is said to be a method developed by Homma Munehisa during early 18th century which evolved into the use of candlestick techniques, and is today a technical analysis charting tool. In the 1920s and 1930s Richard W. Schabacker published several books which continued the work of Charles Dow and William Peter Hamilton in their books Stock Market Theory and Practice and Technical Market Analysis. In 1948 Edwards and John Magee published Technical Analysis of Stock Trends which is widely considered to be one of the seminal works of the discipline. It is exclusively concerned with trend analysis and chart patterns and remains in use to the present. It is now in its 9th edition. As is obvious, early technical analysis was almost exclusively the analysis of charts, because the processing power of computers was not available for statistical analysis. Charles Dow reportedly originated a form of —point and figure chart analysis.
Dow Theory is based on the collected writings of Dow Jones co-founder and editor Charles Dow, and inspired the use and development of modern technical analysis at the end of the 19th century. Other pioneers of analysis techniques include Ralph Nelson Elliott, William Delbert Gann and Richard Wyckoff who developed their respective techniques in the early 20th century. More technical tools and theories have been developed and enhanced in recent decades, with an increasing emphasis on computer-assisted techniques using specially designed computer software.
General Description
While fundamental analysts examine earnings, dividends, new products, research and the like, technical analysts examine what investors fear or think about those developments and whether or not investors have the wherewithal to back up their opinions; these two concepts are called psych (psychology) and supply/demand. Technicians employ many techniques, one of which is the use of charts. Using charts, technical analysts seek to identify price patterns and market trends in financial markets and attempt to exploit those patterns. Technicians use various methods and tools, the study of price charts is but one.
Technicians using charts search for archetypal price chart patterns, such as the well-known head and shoulders or double top/bottom reversal patterns, study technical indicators, moving averages, and look for forms such as lines of support, resistance, channels, and more obscure formations such as flags, pennants, balance days and cup and handle patterns.
Technical analysts also widely use market indicators of many sorts, some of which are mathematical transformations of price, often including up and down volume, advance/decline data and other inputs. These indicators are used to help assess whether an asset is trending, and if it is, the probability of its direction and of continuation. Technicians also look for relationships between price/volume indices and market indicators. Examples include the relative strength index, and MACD. Other avenues of study include correlations between changes in options (implied volatility) and put/call ratios with price. Also important are sentiment indicators such as Put/Call ratios, bull/bear ratios, short interest, Implied Volatility, etc.
There are many techniques in technical analysis. Adherents of different techniques (for example, candlestick charting, Dow Theory, and Elliot Wave Theory) may ignore the other approaches, yet many traders combine elements from more than one technique. Some technical analysts use subjective judgment to decide which pattern(s) a particular instrument reflects at a given time and what the interpretation of that pattern should be. Others employ a strictly mechanical or systematic approach to pattern identification and interpretation.
Technical analysis is frequently contrasted with fundamental analysis, the study of economics factors that influence the way investors price financial markets. Technical analysis holds that prices already reflect all such trends before investors are aware of them. Uncovering those trends is what technical indicators are designed to do, imperfect as they may be. Fundamental indicators are subject to the same limitations, naturally. Some traders use technical or fundamental analysis exclusively, while others use both types to make trading decisions.
Characteristics
Technical analysis employs models and trading rules based on price and volume transformations, such as the elative strength index, moving averages, regressions, inter-market and intra-market price correlations, business cycles, stock market cycles or, classically, through recognition of chart patterns.
Technical analysis stands in contrast to the fundamental analysis approach to security and stock analysis. Technical analysis analyzes price, volume and other market information, whereas fundamental analysis looks at the actual facts of the company, market, currency or commodity. Most large brokerage, trading group, or financial institutions will typically have both a technical analysis and fundamental analysis team.
Technical analysis is widely used among traders and financial professionals and is very often used by active day trading, market makers and pit traders. In the 1960s and 1970s it was widely dismissed by academics. In a recent review, Irwin and Park reported that 56 of 95 modern studies found that it produces positive results but noted that many of the positive results were rendered dubious by issues such as data snooping, so that the evidence in support of technical analysis was inconclusive; it is still considered by many academics to be pseudoscience Academics such as Eugena Fama say the evidence for technical analysis is sparse and is inconsistent with the weak form of the efficient market-market hypothesis. Users hold that even if technical analysis cannot predict the future, it helps to identify trading opportunities.
In the foreign exchange markets, its use may be more widespread than fundamental analysis. This does not mean technical analysis is more applicable to foreign markets, but that technical analysis is more recognized as to its efficacy there than elsewhere. While some isolated studies have indicated that technical trading rules might lead to consistent returns in the period prior to 1987, most academic work has focused on the nature of the anomalous position of the foreign exchange market. It is speculated that this anomaly is due to central bank intervention, which obviously technical analysis is not designed to predict. Recent research suggests that combining various trading signals into a Combined Signal Approach may be able to increase profitability and reduce dependence on any single rule.
Principles
Technicians say that a market's price reflects all relevant information, so their analysis looks at the history of a security's trading pattern rather than external drivers such as economic, fundamental and news events. Price action also tends to repeat itself because investors collectively tend toward patterned behavior – hence technicians' focus on identifiable trends and conditions.
Market action discounts everything
Based on the premise that all relevant information is already reflected by prices, technical analysts believe it is important to understand what investors think of that information, known and perceived; studies such as by Cutler, Poterba, and Sommers titled "What Moves Stock Prices?" do not cover this aspect of investing.
Prices move in trends
Technical analysts believe that prices trend directionally, i.e., up, down, or sideways (flat) or some combination. The basic definition of a price trend was originally put forward by Dow Theory.
An example of a security that had an apparent trend is AOL from November 2001 through August 2002. A technical analyst or trend follower recognizing this trend would look for opportunities to sell this security. AOL consistently moves downward in price. Each time the stock rose, sellers would enter the market and sell the stock; hence the "zig-zag" movement in the price. The series of "lower highs" and "lower lows" is a tell tale sign of a stock in a down trend. In other words, each time the stock moved lower, it fell below its previous relative low price. Each time the stock moved higher, it could not reach the level of its previous relative high price.
Note that the sequence of lower lows and lower highs did not begin until August. Then AOL makes a low price that does not pierce the relative low set earlier in the month. Later in the same month, the stock makes a relative high equal to the most recent relative high. In this a technician sees strong indications that the down trend is at least pausing and possibly ending, and would likely stop actively selling the stock at that point.
History tends to repeart itself
Technical analysts believe that investors collectively repeat the behavior of the investors that preceded them. To a technician, the emotions in the market may be irrational, but they exist. Because investor behavior repeats itself so often, technicians believe that recognizable (and predictable) price patterns will develop on a chart.
Technical analysis is not limited to charting, but it always considers price trends. For example, many technicians monitor surveys of investor sentiment. These surveys gauge the attitude of market participants, specifically whether they are bearish or bullish. Technicians use these surveys to help determine whether a trend will continue or if a reversal could develop; they are most likely to anticipate a change when the surveys report extreme investor sentiment Surveys that show overwhelming bullishness, for example, are evidence that an uptrend may reverse; the premise being that if most investors are bullish they have already bought the market (anticipating higher prices). And because most investors are bullish and invested, one assumes that few buyers remain. This leaves more potential sellers than buyers, despite the bullish sentiment. This suggests that prices will trend down, and is an example of contrarian trading.
Recently, Kim Man Lui, Lun Hu, and Keith C.C. Chan have suggested that there is statistical evidence of association relationships between some of the index composite stocks whereas there is no evidence for such a relationship between some index composite others. They show that the price behavior of these Hang Seng index composite stocks is easier to understand than that of the index.
Industry
The industry is globally represented by the International Federation of Technical Analysts (IFTA), which is a Federation of regional and national organizations. In the United States, the industry is represented by both the Market Technicians Association (MTA) and the American Association of Professional Technical Analysts (AAPTA). The United States is also represented by the Technical Security Analysts Association of San Francisco (TSAASF). In the United Kingdom, the industry is represented by the Society of Technical Analysts (STA). In Canada the industry is represented by the Canadian Society of Technical Analysts. In Australia, the industry is represented by the Australian Technical Analysts Assocation (ATAA).
Professional technical analysis societies have worked on creating a body of knowledge that describes the field of Technical Analysis. A body of knowledge is central to the field as a way of defining how and why technical analysis may work. It can then be used by academia, as well as regulatory bodies, in developing proper research and standards for the field. The Market Technicians Association (MTA) has published a body of knowledge, which is the structure for the MTA's Chartered Market Technician (CMT) exam.
Systematic trading
Neural networks
Since the early 1990s when the first practically usable types emerged, artificial neural networks (ANNs) have rapidly grown in popularity. They are artificial intelligence adaptive software systems that have been inspired by how biological neural networks work. They are used because they can learn to detect complex patterns in data. In mathematical terms, they are universal functino approximators meaning that given the right data and configured correctly, they can capture and model any input-output relationships. This not only removes the need for human interpretation of charts or the series of rules for generating entry/exit signals, but also provides a bridge to fundamental analysis, as the variables used in fundamental analysis can be used as input.
As ANNs are essentially non-linear statistical models, their accuracy and prediction capabilities can be both mathematically and empirically tested. In various studies, authors have claimed that neural networks used for generating trading signals given various technical and fundamental inputs have significantly outperformed buy-hold strategies as well as traditional linear technical analysis methods when combined with rule-based expert systems.
While the advanced mathematical nature of such adaptive systems has kept neural networks for financial analysis mostly within academic research circles, in recent years more user friendly neural network software has made the technology more accessible to traders. However, large-scale application is problematic because of the problem of matching the correct neural topology to the market being studied.
Combination with other market forecast methods
John Murphystates that the principal sources of information available to technicians are price, volume and open interest. Other data, such as indicators and sentimental analysis, are considered secondary.
However, many technical analysts reach outside pure technical analysis, combining other market forecast methods with their technical work. One advocate for this approach is John Bollinger, who coined the term rational analysis in the middle 1980s for the intersection of technical analysis and fundamental analysis.Another such approach, fusion analysis, overlays fundamental analysis with technical, in an attempt to improve portfolio manager performance.
Technical analysis is also often combined with quantitative analysis and economics. For example, neural networks may be used to help identify intermarket relationships. A few market forecasters combine financial astrology with technical analysis. Chris Carolan's article "Autumn Panics and Calendar Phenomenon", which won the Market Technicians Association Dow Award for best technical analysis paper in 1998, demonstrates how technical analysis and lunar cycles can be combined. Calendar phenomena, such as the January effect in the stock market, are generally believed to be caused by tax and accounting related transactions, and are not related to the subject of financial astrology.
Investor and newsletter polls, and magazine cover sentiment indicators, are also used by technical analysts.
Empirical evidence
Whether technical analysis actually works is a matter of controversy. Methods vary greatly, and different technical analysts can sometimes make contradictory predictions from the same data. Many investors claim that they experience positive returns, but academic appraisals often find that it has little predictive power. Of 95 modern studies, 56 concluded that technical analysis had positive results, although data snooping bias and other problems make the analysis difficult.Nonlinear prediction using neural networks occasionally produces statistically significant prediction results. A Federal Reserve working paper regarding support and resistance levels in short-term foreign exchange rates "offers strong evidence that the levels help to predict intraday trend interruptions," although the "predictive power" of those levels was "found to vary across the exchange rates and firms examined".
Technical trading strategies were found to be effective in the Chinese marketplace by a recent study that states, "Finally, we find significant positive returns on buy trades generated by the contrarian version of the moving average crossover rule, the channel breakout rule, and the Bollinger band trading rule, after accounting for transaction costs of 0.50 percent. An influential 1992 study by Brock et al. which appeared to find support for technical trading rules was tested for data snooping and other problems in 1999; the sample covered by Brock et al. was robust to data snooping.
Subsequently, a comprehensive study of the question by Amsterdam economist Gerwin Griffioen concludes that: "for the U.S., Japanese and most Western European stock market indices the recursive out-of-sample forecasting procedure does not show to be profitable, after implementing little transaction costs. Moreover, for sufficiently high transaction costs it is found, by estimating CAPMs, that technical trading shows no statistically significant risk-corrected out-of-sample forecasting power for almost all of the stock market indices."Transaction costs are particularly applicable to "momentum strategies"; a comprehensive 1996 review of the data and studies concluded that even small transaction costs would lead to an inability to capture any excess from such strategies.
In a paper published in the Journal of Finance, Dr. Andrew W. Lo, director MIT Laboratory for Financial Engineering, working with Harry Mamaysky and Jiang Wang found that "
Technical analysis, also known as "charting," has been a part of financial practice for many decades, but this discipline has not received the same level of academic scrutiny and acceptance as more traditional approaches such as fundamental analysis. One of the main obstacles is the highly subjective nature of technical analysis—the presence of geometric shapes in historical price charts is often in the eyes of the beholder. In this paper, we propose a systematic and automatic approach to technical pattern recognition using nonparametric kernel regression, and apply this method to a large number of U.S. stocks from 1962 to 1996 to evaluate the effectiveness of technical analysis. By comparing the unconditional empirical distribution of daily stock returns to the conditional distribution—conditioned on specific technical indicators such as head-and-shoulders or double-bottoms—we find that over the 31-year sample period, several technical indicators do provide incremental information and may have some practical value.
In that same paper Dr. Lo wrote that "several academic studies suggest that ... technical analysis may well be an effective means for extracting useful information from market prices. Some techniques such as Drummond Geometry attempt to overcome the past data bias by projecting support and resistance levels from differing time frames into the near-term future and combining that with reversion to the mean techniques.
Efficient market hypothesis
The efficient market hypothesis (EMH) contradicts the basic tenets of technical analysis by stating that past prices cannot be used to profitably predict future prices. Thus it holds that technical analysis cannot be effective. Economist Eugene Fama published the seminal paper on the EMH in the Journal of Finance in 1970, and said "In short, the evidence in support of the efficient markets model is extensive, and (somewhat uniquely in economics) contradictory evidence is sparse."
Technicians say that EMH ignores the way markets work, in that many investors base their expectations on past earnings or track record, for example. Because future stock prices can be strongly influenced by investor expectations, technicians claim it only follows that past prices influence future prices. They also point to research in the field of behavioral finance, specifically that people are not the rational participants EMH makes them out to be. Technicians have long said that irrational human behavior influences stock prices, and that this behavior leads to predictable outcomes. Author David Aronson says that the theory of behavioral finance blends with the practice of technical analysis:
By considering the impact of emotions, cognitive errors, irrational preferences, and the dynamics of group behavior, behavioral finance offers succinct explanations of excess market volatility as well as the excess returns earned by stale information strategies.... cognitive errors may also explain the existence of market inefficiencies that spawn the systematic price movements that allow objective TA [technical analysis] methods to work.
EMH advocates reply that while individual market participants do not always act rationally (or have complete information), their aggregate decisions balance each other, resulting in a rational outcome (optimists who buy stock and bid the price higher are countered by pessimists who sell their stock, which keeps the price in equilibrium).
Likewise, complete information is reflected in the price because all market participants bring their own individual, but incomplete, knowledge together in the market.
Random walk hypothesis
The random walk hypothesis may be derived from the weak-form efficient markets hypothesis, which is based on the assumption that market participants take full account of any information contained in past price movements (but not necessarily other public information). In his book A Random Walk Down Wall Street, Princeton economist Burton Malkiel said that technical forecasting tools such as pattern analysis must ultimately be self-defeating: "The problem is that once such a regularity is known to market participants, people will act in such a way that prevents it from happening in the future."
In the late 1980s, professors Andrew Lo and Craig McKinlay published a paper which cast doubt on the random walk hypothesis. In a 1999 response to Malkiel, Lo and McKinlay collected empirical papers that questioned the hypothesis' applicability that suggested a non-random and possibly predictive component to stock price movement, though they were careful to point out that rejecting random walk does not necessarily invalidate EMH, which is an entirely separate concept from RWH. In a 2000 paper, Andrew Lo back-analyzed data from U.S. from 1962 to 1996 and found that "several technical indicators do provide incremental information and may have some practical value".
Technicians say that the EMH and random walk theories both ignore the realities of markets, in that participants are not completely rational and that current price moves are not independent of previous moves.
Charting terms and indicators.
Concepts
- Resistance — a price level that may prompt a net increase of selling activity
- Support — a price level that may prompt a net increase of buying activity
- Breakout — the concept whereby prices forcefully penetrate an area of prior support or resistance, usually, but not always, accompanied by an increase in volume.
- Trending — the phenomenon by which price movement tends to persist in one direction for an extended period of time
- Average true range — averaged daily trading range, adjusted for price gaps
- Chart pattern — distinctive pattern created by the movement of security prices on a chart
- Dead cat bounce — the phenomenon whereby a spectacular decline in the price of a stock is immediately followed by a moderate and temporary rise before resuming its downward movement
- Elliott wave principle and the golden ratio to calculate successive price movements and retracements
- Fibonacci ratios — used as a guide to determine support and resistance
- Momentum — the rate of price change
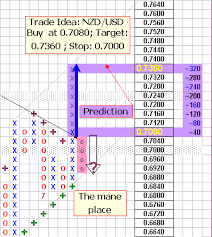
- Point and figure analysis — A priced-based analytical approach employing numerical filters which may incorporate time references, though ignores time entirely in its construction.
- Cycles - time targets for potential change in price action (price only moves up, down, or sideways)
Types of charts
- Open-high-low-close chart — OHLC charts, also known as bar charts, plot the span between the high and low prices of a trading period as a vertical line segment at the trading time, and the open and close prices with horizontal tick marks on the range line, usually a tick to the left for the open price and a tick to the right for the closing price.
- Candle Stick Chart — Of Japanese origin and similar to OHLC, candlesticks widen and fill the interval between the open and close prices to emphasize the open/close relationship. In the West, often black or red candle bodies represent a close lower than the open, while white, green or blue candles represent a close higher than the open price.
- Line Chart — Connects the closing price values with line segments.
- Point and figure chart — a chart type employing numerical filters with only passing references to time, and which ignores time entirely in its construction.
Overlays
Overlays are generally superimposed over the main price chart.
- Resistance — a price level that may act as a ceiling above price
- Support — a price level that may act as a floor below price
- Trend Line — a sloping line described by at least two peaks or two troughs
- Channel — a pair of parallel trend lines
- Moving Average — the last n-bars of price divided by "n" -- where "n" is the number of bars specified by the length of the average. A moving average can be thought of as a kind of dynamic trend-line.
- Bollinger bands — a range of price volatility
- Parabolic SAR — Wilder's trailing stop based on prices tending to stay within a parabolic curve during a strong trend
- Privot point — derived by calculating the numerical average of a particular currency's or stock's high, low and closing prices
- Ichimoku kinko hyo — a moving average-based system that factors in time and the average point between a candle's high and low
Price-based indicators
These indicators are generally shown below or above the main price chart.
- Advance decline line — a popular indicator of market breadth
- Average Directional Index — a widely used indicator of trend strength
- Commodity Channel Index — identifies cyclical trends
- MACD — moving average convergence/divergence
- Relative Strength Index (RSI) — oscillator showing price strength
- Stochastic oscillator — close position within recent trading range
- Trix — an oscillator showing the slope of a triple-smoothed exponential moving average
- Momentum — the rate of price change
Volume-based indicators
- Accumulation/distribution index — based on the close within the day's range
- Money flow — the amount of stock traded on days the price went up
- On-Balance volume — the momentum of buying and selling stocks
.png) Dr. Wealth 財富博士 Dr. Wealth 財富博士 |


